Crypto Trading 101: Stochastic Oscillator and Price Momentum
Signals, Trading
When you’re dealing with a cryptocurrency of any kind, it’ll significantly help if you’re familiar with a “leading indicator.” You may have heard many terms like “bullish,” “bearish,” “overbought,” etc. These terms have a lot to do with representing a cryptocurrency’s current value.
One less common term that people don’t use much is the “stochastic oscillator.” Don’t worry; it isn’t a concept too challenging to understand. The stochastic oscillator is also a leading indicator that lets traders know about their cryptocurrency’s current worth.
If you’ve never heard of it before, stay tuned to learn how it works.
What Is the Stochastic Oscillator?
Thanks to technology, many tools have emerged that make it easier for traders and investors to hold their cryptocurrencies. People can now use unique tools to be on the same page as their crypto. Many leading indicators are helping investors keep track of their asset's current value, helping them gauge potential risks.
The stochastic oscillator is one such tool that has been part of the blockchain for now. It's a momentum indicator that compares the closing price of an asset with the high-low range over a specific period. An excellent feature of the stochastic indicator is that no matter the volatility of the crypto market, it does its job well of running value comparisons over certain periods.
To use the stochastic oscillator, you might have to understand a bit of math. The equation goes like this:
Slow %K= 100 [Sum of the (C - L14) for the %K Slowing Period / Sum of the (H14 – L14) for the %K Slowing Period]
Slow %D = SMA of Slow %K
Here’s what the equation denotes:
- L14: Lowest low for the last 14 periods.
- H14: Highest high for the same 14 periods.
- C: Latest close.
- %K: 3.
If you’re not the best at math, you’re in luck. As a trader, you wouldn’t have to solve or put values into this complex formula as platforms and software do so for you. All you need to learn is how to read a stochastic oscillator, which is another story altogether.
How to Read the Stochastic Oscillator?
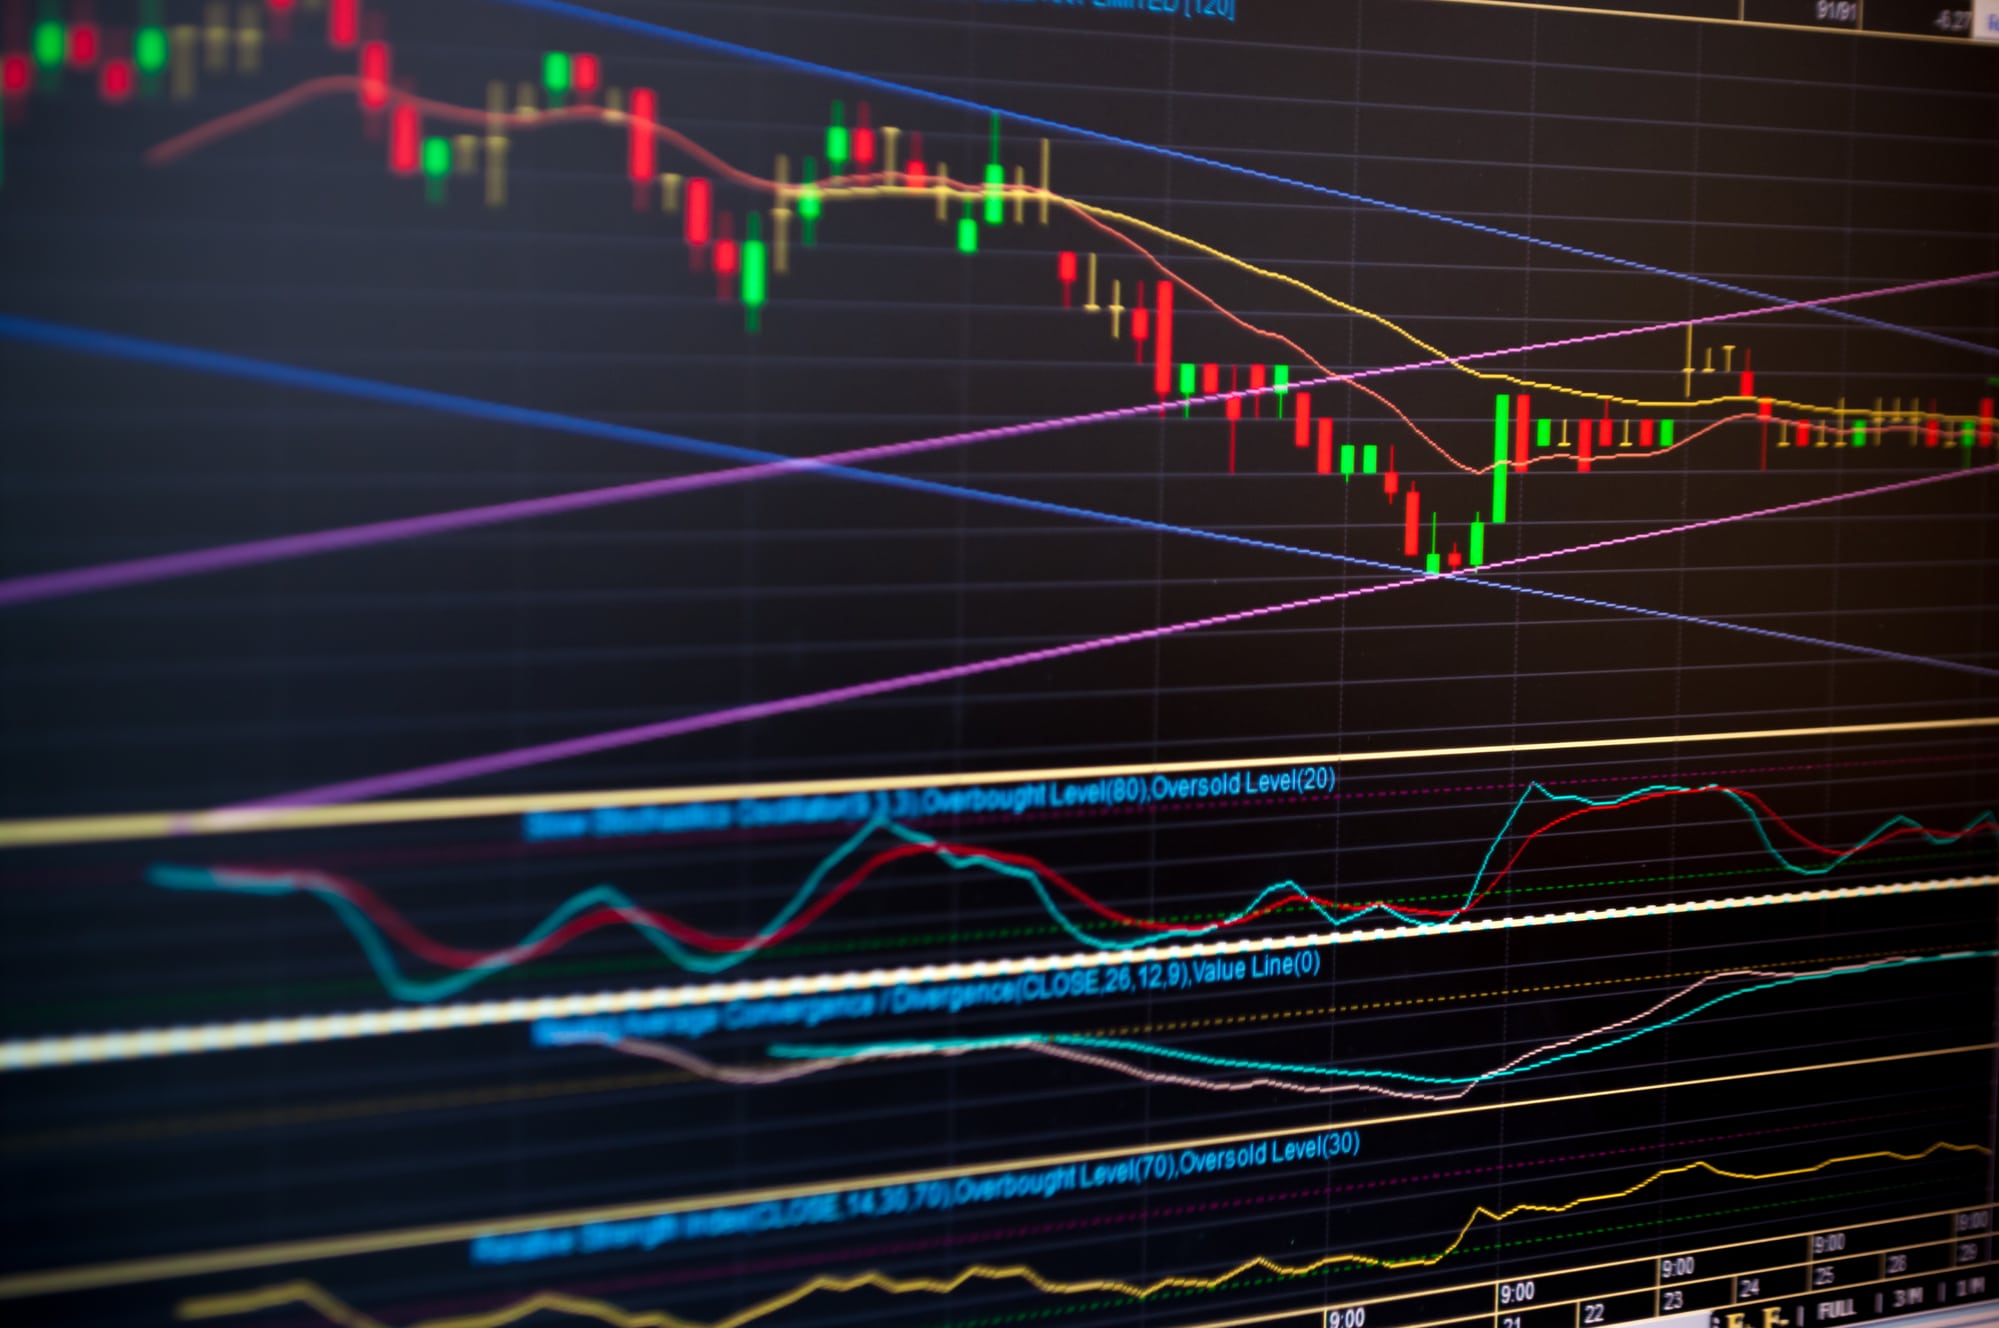
Firstly, you need to understand the indicator this tool has. The indicator ranges from 0 to 100. The range above 80 represents an overbought condition, and below 20 represents an oversold condition. Overbought is a situation where a security is traded at a far greater level than its fair value. At the same time, an oversold condition is the opposite, when the security is sold at a far lesser level than its intrinsic value.
So, whenever you see security at the above 80 areas, it’ll result in a rally of prices as the security will be in an overbought zone. Contrastingly, the stochastic oscillator will show a decrement in prices if the security is in the oversold condition. The latter indicates that the prices have reached a level of exhaustion and that specific security is now declining.
As a trader, you need to look for trend reversal signs as your investment depends on it. The %K and %D lines represent where the security is headed, whether it has crossed the overbought or oversold region. Here’s what you should be checking your security for:
- Buy Signal = %K line crosses %D line from below in the oversold territory.
- Sell Signal = %K line crosses %D line from above in the overbought territory.
What Does the Stochastic Oscillator Tell You?
Even though the stochastic oscillator is a handy tool that lets you know about overbought and oversold conditions, it doesn’t necessarily guarantee there’s an impending reversal waiting to take place. Don’t always stick to what the signs indicate whenever you use this oscillator. Instead, it’s best if you study the stochastic oscillator for clues about future shifts in values.
This tool is a great one to help determine current and future patterns. When you’re reading a stochastic oscillator, be mindful of two lines. One determines the actual value of each session on the oscillator, and the other represents a three-day line depicting the moving average. Since the prices are considered to follow momentum, the overlapping of these two lines represents that a trend reversal may take place soon. This trend reversal determines that the momentum is about to go through a massive shift.
When studying the stochastic oscillator, you also need to consider the divergence between the oscillator and the trending price. If the bearish trend reaches a lower low, and the oscillator indicates it as a higher low, it means that the bears are declining from their momentum and a bullish trend is in the works. This implies another kind of reversal signal.
Stochastic Oscillator vs. Relative Strength Index (RSI)
The stochastic oscillator works on the assumption that the closing price will be the same as the current trend. This assumption can be volatile as nobody can guarantee a specific trend in the crypto market. However, so far, the stochastic oscillator has been quite a handy tool as it gives traders a good insight into the overbought and oversold conditions.
The RSI, however, works much differently. It tracks the velocity of the security’s price instead of predicting any trends for the current and future price. The RSI was developed to study the speed at which the price changes momentum. In a nutshell, RSI is an excellent tool to measure how fast are the security’s price movements.
Conclusion: The Handier Tool?
Both of these tools are significant when running a technical analysis. They’re often used side-by-side as both have varying features that predict trends in different unique ways. These two tools have fundamental theories and methods regarding price trends and are highly useful for traders who need to analyze where their security is headed.
They serve their purposes of giving investors a good idea about pricing trends. The one you should use will depend on the type of security you’ve invested in. For example, if you want to learn about consistent trading ranges, the stochastic oscillator is for you. But if you want to know the speed of any price changes, you should opt for using the RSI.
Related Articles

Common Trading Mistakes and to Avoid Them as a Beginner
How to Spot Correction Warning Signs to Protect Your Portfolio