3 Ways the Relative Strength Index (RSI) Can Be Used as a Sell Signal

Cryptocurrencies, Signals, Trading
One of the most popular technical analyses used by traders is the Relative Strength Index or the RSI indicator. RSI indicator is a momentum oscillator that predicts price movements of an asset over a short period of time. It is an excellent tool that gives you an idea of what your investment will do and helps you make buying or selling decisions accordingly.
The RSI indicator has been around since 1980, and almost all traders use it to analyze when is the right time to buy and sell stocks. Crypto traders also use RSI indicators to plot entry and exit points. But how is the Relative Strength Index a reliable indicator in volatile crypto markets? Let's find out.
What Is RSI?
The relative strength index was first introduced in 1978 by J. Welles Wilder Jr. The RSI was developed to measure the magnitude of price changes to estimate oversold or overbought conditions in a stock or asset price. Traditionally, RSI evaluates the change in stock price or crypto over 2 weeks but can be reduced or extended according to the traders' investment perspective. It can be measured in days, weeks, hours, or even minutes.
The RSI is displayed as a line graph between two extremes from 0 – 100. It is used to spot the overbought or oversold levels of any asset. A reading of 70 or above indicates that a stock is becoming overbought and a reading of 30 or below indicates an oversold security.
An RSI reading between 50 and 100 indicates a bullish trend, while an RSI reading between 0 – 50 signals a bearish trend. A reading of 50 is considered neutral, meaning an equal balance between the bulls and bears.
The RSI Formula:
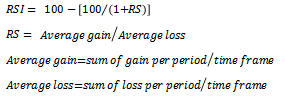

How The RSI Is Used As A Sell Signal
A specific time frame is needed to calculate the Relative Strength Index. Any time period from 5 days to 50 days can be used, but a 14-day period is more precise. We take the average gain of cryptos price during the time frame and divide it but average loss. The average gain is the average of how much the price has increased from each of its low points in a designated time frame. Similarly, the average loss is how much the price has gone down from each of its highs. When we divide these two, we get the RSI value.
These values are then plugged into a graph to estimate price changes. The price change oscillates between 0 – 100, where a number over 70 indicates the market is overbought, and a number below 30 indicates it is oversold.
Now let's find out how the Relative Strength Index helps traders make buying and selling decisions.
Overbought vs. Oversold
As we read above, overbought signals are when the indicator rises above 70, and oversold signals are when the indicator drops below 30. But it isn't as simple as it may seem.
When a market is trending, there is much more going on beyond the indicators. For example, a market can be overbought for an extended period of time and vice versa. So, while simply using the RSI indicator in crypto, there's no telling when the market has reached its peak or bottom.
Generally, when a security is overbought, it is a clear sign of a looming downward trend. On the contrary, when a security is oversold, it shows an incoming upward trend. Therefore, traders ideally buy a security in the oversold territory and sell it when it reaches the overbought territory.
Another common trading strategy is buying or selling crypto when it hits the midline or crosses it. This signals the start of a new trend. When the RSI is above 50, a bullish trend is developing; when it's below 50, it starts a bearish trend.
While using the midline cross strategy, traders buy or sell using the ratio of 50/50, 60/40, or 70/30. A trend reversal may follow when the resistance suffers a hit; hence, traders should take action accordingly.
However, when a coin breaks out of critical resistance levels, it starts a new upward trend. This means that the possibility of RSI remaining in the overbought territory is high. This happens because traders identify the start of a new trend and don't wait for a dip in price to start buying coins. The sustained buying causes the RSI to remain in the overbought territory for a longer duration. In such a scenario, the security should not be sold just because the RSI has risen above 70, or traders may miss out on extra gains that they could've made had they waited.
Contrarily, traders should be cautious when an RSI rises above 85 and look for other supporting signals before initiating long positions. Traders who sell their securities in strong bull stages have chances to reap early profits. After this stage, securities are likely to fall into the oversold territory, allowing buyers to enter the market. Therefore, no single indicator or strategy will work every time.
RSI Divergence
The RSI oscillator rises when the security price rises, but sometimes this does not happen. This phenomenon points out the bearish and bullish points.
Buying and selling on divergence offer you more assurance and a lower chance of misreading the signals.
When a cryptocurrency continues to make higher highs, but the RSI continues to make lower highs, it is a sign that a bullish trend is approaching. When a negative divergence forms, traders should wait for the price to react downward before selling their security.
A bullish divergence signal shows lower low-price action on the market chart and a higher low on RSI. This means the crypto asset is gaining momentum for a bullish trend.
In some bearish divergence cases, RSI fails to give a selling signal. Therefore, you mustn't rely on one indicator alone. In such cases, a break below the moving averages signals that a trend is changing, and traders should take action accordingly.
How Spotting Divergences Is Profitable
The RSI is an essential indicator that signals the end of a bullish trend. Negative divergences and extreme reading in the overbought territory can be used to book profits before the trend shifts.
Rather than timing the top, traders should use the RSI readings and moving averages signals to sell a security before it loses momentum.
Benefits Of Using RSI
RSI is a widely used indicator because of its advantages:
- It's easy to use and stays within a bounded range
- It is an efficient tool with high predictive quality
- It gives a signal within a short time
However, it does have a few drawbacks. Using the RSI alone as an indicator will not give accurate results and lead to wrong decisions by the trader. Spotting a wrong signal is almost impossible. It is likely to give out false signals.
Key Takeaways
The Relative Strength Index is a leading indicator that predicts future price actions and effectively maps out high probability entry points but alone isn't enough for traders to make entry and exit decisions. Traders usually combine the Bollinger Bands indicators for a dual strategy to better time bullish and bearish points.
Remember that RSI isn't a 100% guarantee and should be used as an advantage with other technical analysis indicators.
Related Articles

Ethereum Faces Selling Pressure Amid ETF Outflows

Crypto Signals & Layer 1 Basics