5 Ways Investors Can Use the MACD Indicator to Make Better Trades
Investment, Trading
There are many tools crypto traders use to make trading decisions, such as the relative strength index (RSI), the stochastic oscillator, and on-balance volume. However, if there's one tool making all the headlines in 2022, it's the MACD indicator. This incredibly powerful tool helps traders identify short-term trend directions quickly and easily.
How?
Simply put, cryptocurrencies are extremely volatile compared to stocks. Therefore, they're highly susceptible to market changes and often require traders to make quick decisions. Unfortunately, most new traders don't effectively use moving average convergence divergence to their advantage.
Therefore, in this post, we’ll share five ways investors can use the MACD indicator to make better trades and improve their win-to-loss ratio.
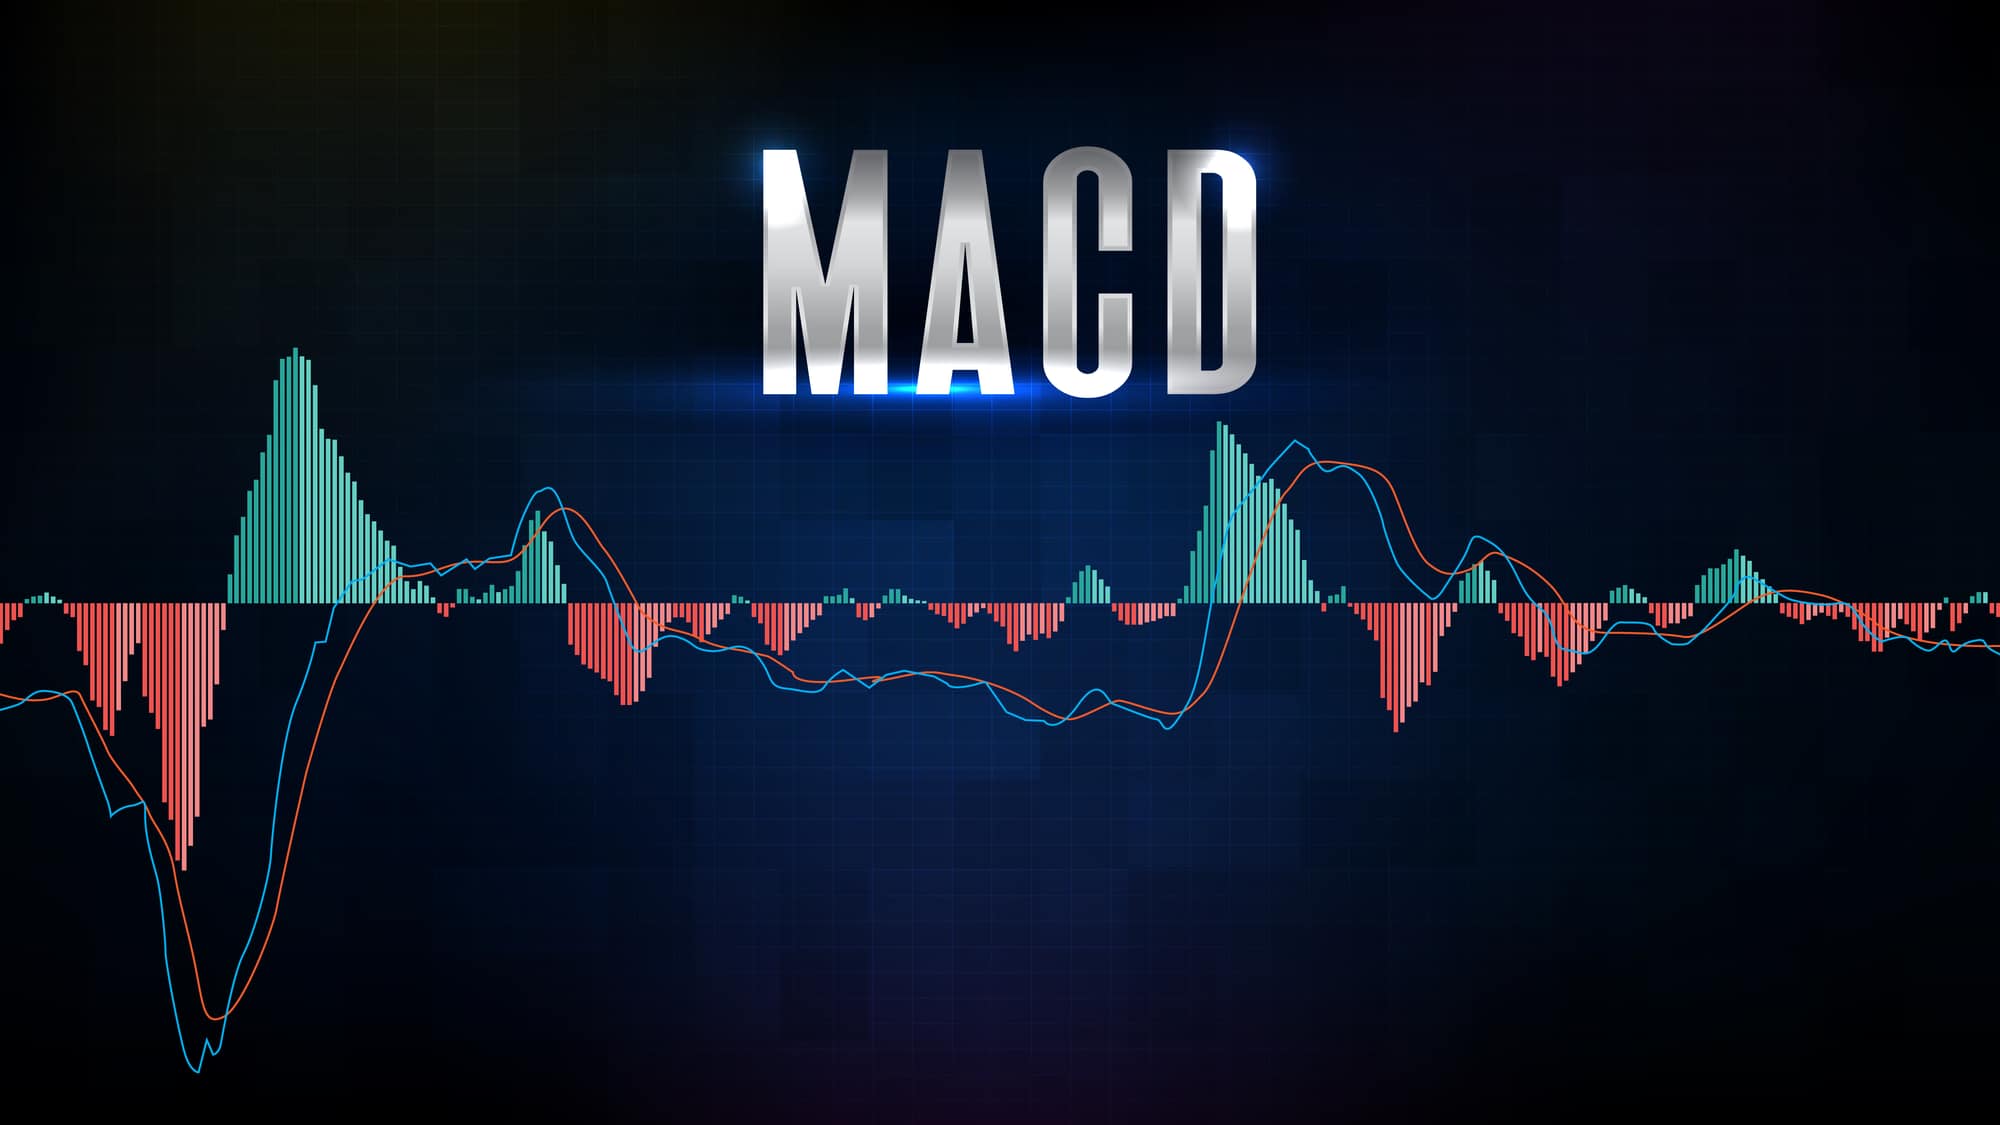
What is the MACD Indicator?
The moving average convergence divergence indicator is a momentum oscillator traders use to follow market trends (bullish or bearish). It essentially involves following two lines on a histogram – a MACD line and a signal line. When the MACD line crosses below the signal line, it signals a bearish trend, and vice versa.
This tool was invented in 1979 by Gerald Appel to help traders easily calculate an asset's price direction, strength, momentum, and length. These readings can help determine a crypto trend's overall strength or weakness. For instance, most current Bitcoin traders are using it to anticipate the bearish trend's length. Let's dive deeper into how the tool works by explaining its three key components:
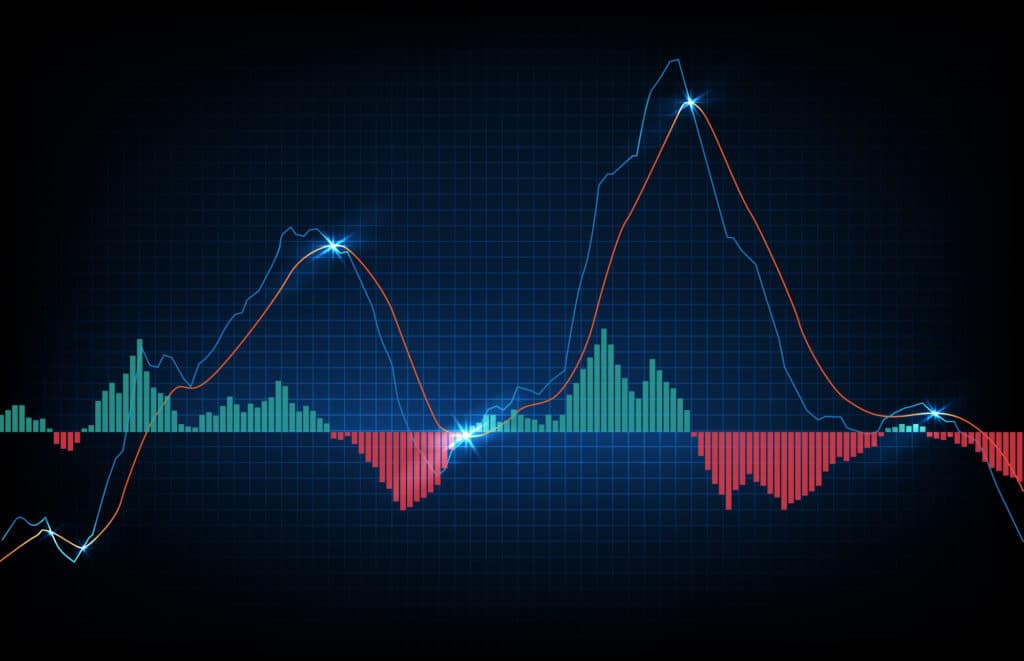
1. The MACD Line
This line represents the fastest moving average or short-term exponential moving average (EMA). On most charts, it’s colored blue. Here’s how to calculate it:
MACD Line = 12-day short-term EMA – 26-day long-term EMA
2. The Signal Line
This represents the slowest moving average or long-term EMA. It is a red 9-day line showing the turns of the asset's price action. Simply put,
Signal Line = 9-day EMA of MACD Line
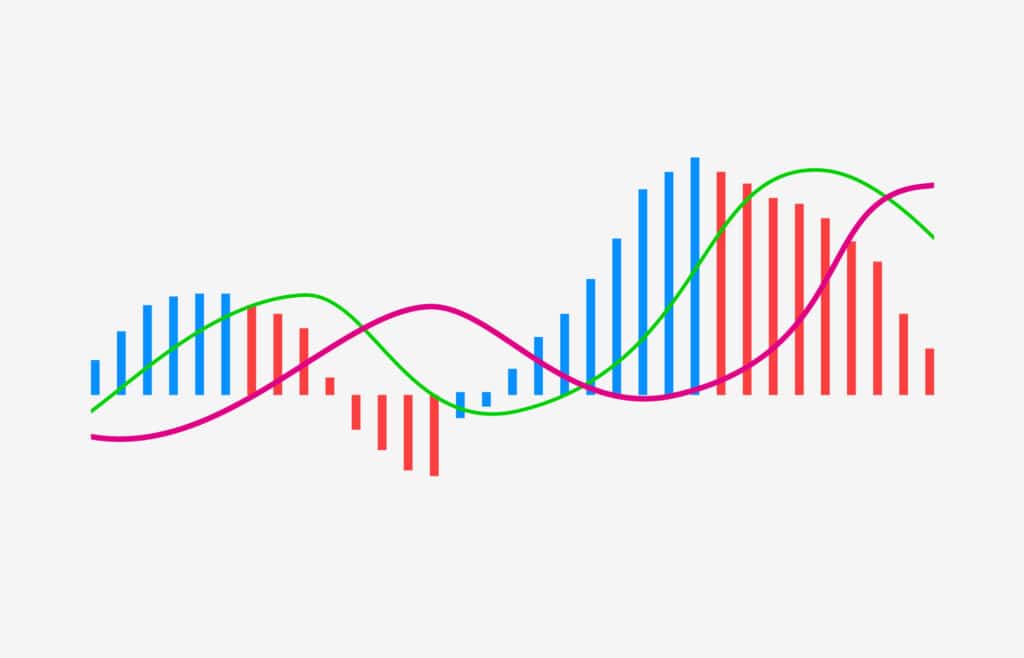
3. The MACD Histogram
The MACD histogram helps traders identify bullish and bearish trends. It’s simply the difference between the MACD line and the Signal line on the graph. The histogram is positive if the reading fluctuates above the zero line (bullish). Similarly, the histogram is negative (bearish) if it's below the zero line.
How to Use the MACD Indicator to Make Better Trades
Now that you’re up to speed with how the MACD indicator works, here are five ways you can use this powerful tool to make better trades:
1. Use the Indicator to Measure Crypto Market Volatility
As mentioned before, crypto assets are relatively more volatile compared to their legacy counterparts. Therefore, they witness large movements in a short time. Thus, the MACD indicator can prompt crypto traders to enter and exit trades to minimize losses quickly.
Moreover, cryptocurrency trends typically experience a fair share of daily, weekly, or monthly corrections, so you can use this tool to stay on top of minor changes.
2. Use Two MACDs Simultaneously
Most charting software uses the 12-to 26-day MACD combination by default. However, you can also use the 19-to 39-day MACD combination to generate sell signals due to its less sensitive nature. We recommend opting for the 6-to 19-day MACD combination for buy signals due to its higher fluctuation sensitivity.
However, the combination you pick depends on the platform you’re using and the cryptocurrency you’re trading. More importantly, if you can’t use multiple indicators at once, stick to the default 12-to 26-day combination.
3. Buy Pullbacks
The MACD is an excellent tool for buying pullbacks, especially during corrections in an uptrend. In this period, the MACD drops the signal line. However, as soon as the price resumes its upward trajectory, the reading rebounds off the signal line – giving traders a precise entry point or good buying opportunity. However, if you're going to employ this strategy, you have to pay attention to two things.
First, you need to consider the cryptocurrency you’re trading. Although all crypto assets are volatile, some are more volatile than others. Great options for pullback trading include Bitcoin, Cardano, Dash, and Shiba Inu. Secondly, you need to look for the currency with the highest uptrend.
For instance, Solana’s volatility index reached up to 7183% in 2021. Since the coin's inception in 2020, it has grown by 12000% to reach $92. It has amassed a market cap of $32 billion in just two years.
4. Use MACD Divergences to Look For Trend Changes
From Feb 2021 to April 2021, Bitcoin experienced a massive uptrend which took its value to over $65,000. Although this period main consisted of higher highs, the MACD indicator made lower highs – indicating a bearish divergence.
Simply put, this was a sign that the momentum was finally weakening and prompted savvy traders to proactively take caution and steer clear of long trades after March 2021. In Feb 2022, Bitcoin's value stands at $39,000.
The MACD indicator is an excellent tool for spotting reversals. However, it can also be inaccurate at times and produce false signals. Therefore, you should confirm the trend using price action analysis.
5. Buy Short and Sell Long
Lastly, the MACD indicator helps users strategize their buy and sell positions. For instance, when the MACD crosses above zero, it indicates a buying opportunity. Therefore, you should close a short position as soon as possible. Similarly, when the MACD crosses below the zero line, sell and close a long position.
However, the key here is timing. You could lose money if you delay either option, especially in extremely volatile conditions.
Conclusion
Overall, the MACD is an excellent tool for capturing trends and anticipating a cryptocurrency’s momentum during a defined period. The general rule of thumb is simple – use a more sensitive MACD for more volatile coins and the default or less sensitive MACD for slow movers. However, keep in mind that, like most indicators, the moving average convergence divergence indicator isn't perfect.
Even with the best permutations and combinations, it can often generate false signals. Therefore, you should combine it with more technical tools to minimize losses.
Related Articles

The 2 Key Price Indicators Every Crypto Trader Should Know

How Traders Can Get Rich With Crypto