
Bitcoin Is 50% Below Its All-Time High — What Happens Next? The Honest Data (2026)
Bitcoin, Signals, Trading
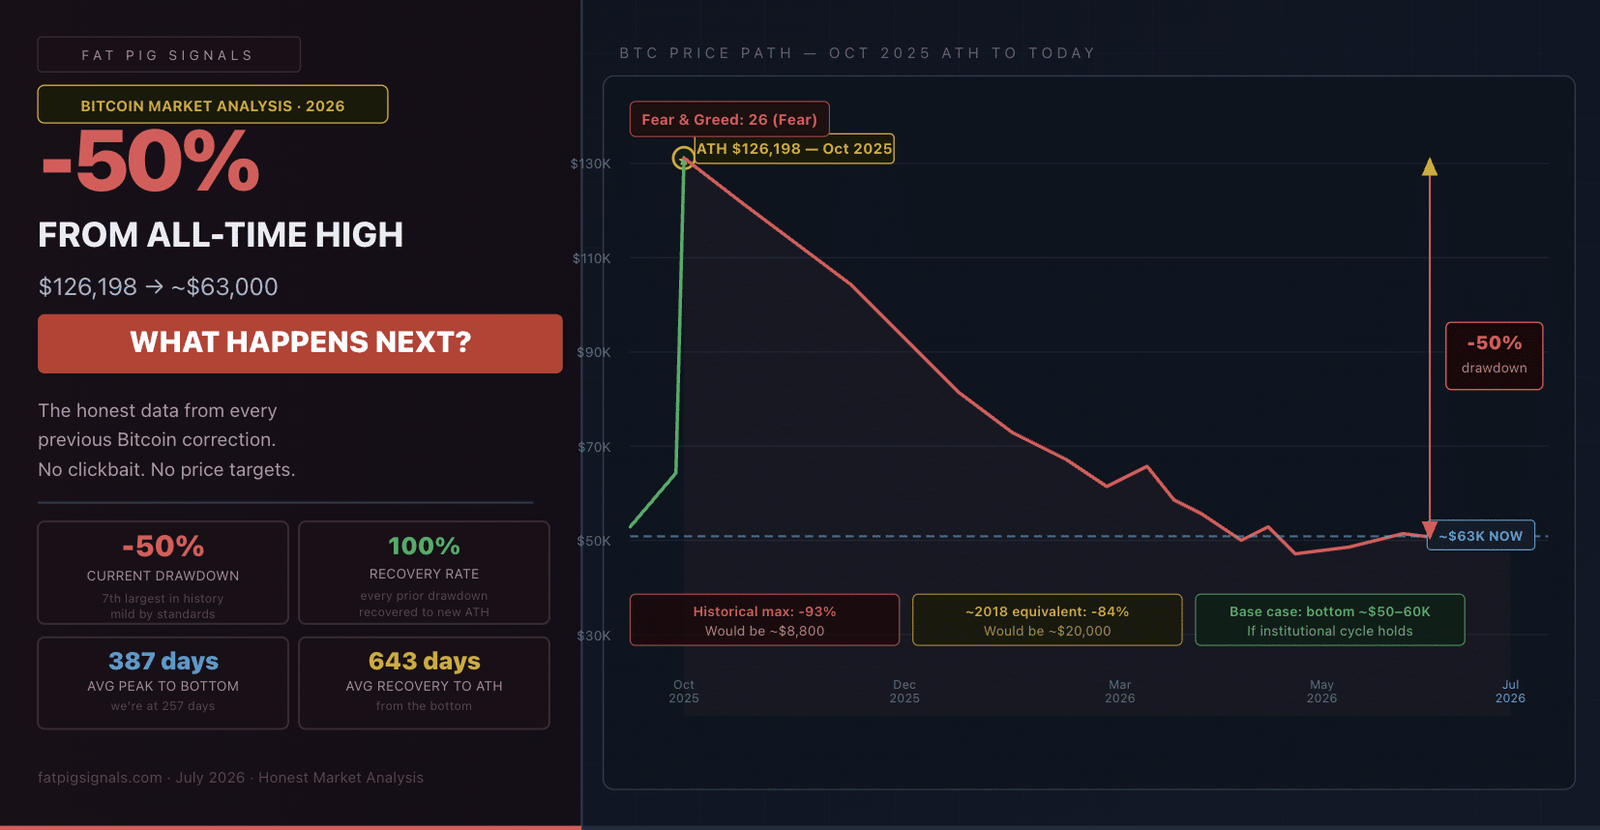
Bitcoin hit $126,198 on October 6, 2025.
Fourteen days later, it was the highest price any single Bitcoin had ever sold for in history. Institutions were pouring money in. ETF inflows were hitting records. Headlines were predicting $200,000 by year end.
Today — July 13, 2026 — Bitcoin is trading near $63,000.
That's a 50% drawdown from the all-time high. Nine months of selling, consolidation, and fear. The Fear & Greed Index is sitting at 26. Reddit is asking if the bull market is over. YouTube gurus have quietly pivoted to "why I sold everything" content.
So what actually happens next?
Not what any single analyst predicts — because no single analyst consistently gets this right. But what the historical data across every major Bitcoin correction tells us, honestly, without the clickbait price targets.
First: Put the 50% Drawdown in Context
Every time Bitcoin falls significantly from a peak, a new wave of people convinces themselves this time is different — that this is the correction that finally breaks the pattern.
Here's what the actual historical record shows:
| Cycle Peak | Price at Peak | Maximum Drawdown | Bottom Price | Recovery Time to New ATH |
|---|---|---|---|---|
| 2011 peak | ~$31 | -93% | ~$2 | ~2 years |
| 2013 peak | ~$1,150 | -85% | ~$170 | ~3 years |
| 2017 peak | ~$19,783 | -84% | ~$3,200 | ~3 years |
| 2021 peak | ~$69,000 | -77% | ~$15,500 | ~2 years |
| 2025 peak | $126,198 | -50% so far | ~$58K (recent low) | In progress |
Historically, recovery from major crashes has taken 2–3 years. The 2011 crash (-93%) recovered in approximately 2 years, the 2014 crash (-85%) in 3 years, the 2018 crash (-84%) in 3 years, and the 2022 crash (-77%) in approximately 2 years.
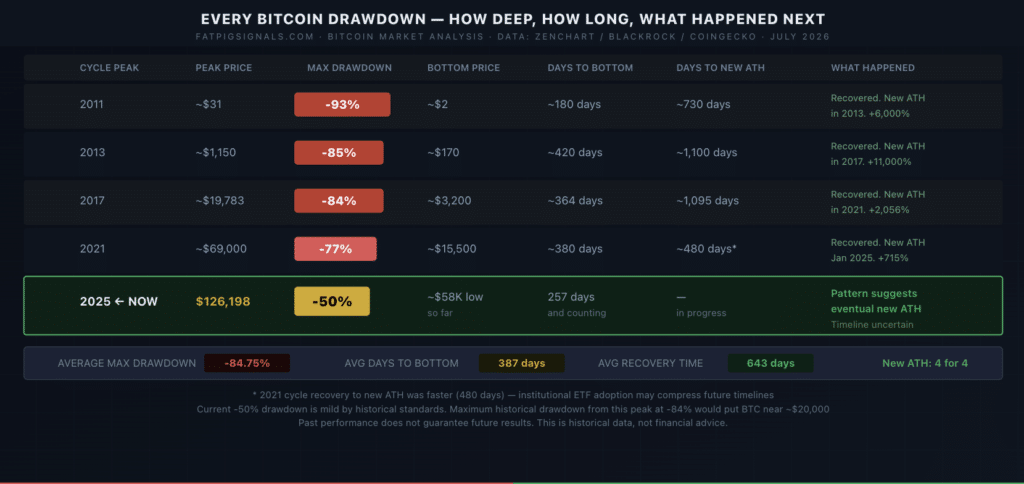
The current drawdown — severe as it feels — is, by Bitcoin's historical standards, relatively mild so far.
That doesn't mean it's over. Since 2014, Bitcoin has experienced four drawdowns in excess of 50%. While one of these was followed by a quick six-month recovery, the three largest drawdowns averaged an approximately 80% decline.
A full historical-scale correction from $126,198 would put Bitcoin somewhere near $25,000–$37,000 at the extreme.
Whether that happens depends on factors no chart can predict with certainty. But understanding the range of historical outcomes — not just the comfortable middle scenario — is what separates informed decision-making from wishful thinking.
The key insight from the data: Bitcoin has fallen 50%+ from peak levels multiple times. In every single instance without exception, it eventually recovered to new all-time highs and went higher. The question has never been if — it's always been when and whether you held enough to benefit.
Where We Are in the Cycle
The current drawdown from the October 2025 peak has reached 52.5% over 122 days, the 7th largest in Bitcoin's history.
Let's map the typical Bitcoin cycle and honestly mark where we appear to be:
Phase 1 — Post-Halving Accumulation (Months 0–12 post-halving) Supply shock builds quietly. Institutional and long-term holders accumulate. Price moves gradually. This was 2024.
Phase 2 — Bull Market Expansion (Months 12–18) Supply squeeze kicks in. Price breaks to new all-time highs. Media coverage explodes. Retail FOMO peaks. This was late 2024 through October 2025 — the run from $40K to $126K.
Phase 3 — Correction Phase (Months 18–30) Post-euphoria reality check. Early buyers take profits. Late buyers panic sell. Price corrects. This is where we are now — approximately 9 months into the correction.
Phase 4 — Bottom Formation & Recovery (Months 24–40) Maximum pain. Capitulation. "Bitcoin is dead" headlines. Then slowly, quietly, smart money returns.
The average peak-to-bottom timeline across historical cycles is 387 days. Bitcoin is currently at ~$63,000, down from $126,000 in October 2025. If historical patterns hold, a bottom may form in late 2026.
We are approximately 257 days from the October 2025 peak. Historical average to bottom: 387 days. If the pattern holds, the bottom may not yet be in — but we are statistically in the zone where previous cycles began forming their lows.
Critical caveat: Bitcoin cycles are built on a sample size of three completed rounds, stress-tested by models that fail when you actually run them forward. The gap between "understanding the cycle" and "surviving it with capital intact" is where most accounts go to die. Cycle timing is a framework for orientation, not a precise calendar.
What the Institutional Shift Changes
Every previous cycle played out in a market dominated by retail traders and crypto-native capital. This cycle is structurally different in one important way: spot Bitcoin ETFs.
BlackRock's IBIT, Fidelity's FBTC, and others launched in January 2024 and have consistently attracted institutional capital. ETF buying is now likely to be the primary driver of future Bitcoin price increases, with institutional adoption and market maturation continuing regardless of short-term price action.
This matters for the drawdown analysis because:
- Institutional holders have longer time horizons and higher conviction — they are less likely to capitulate at -50% than retail traders who bought the ATH on leverage
- ETF flows provide a structural bid — new money continues entering via ETFs even during corrections, providing a floor that didn't exist in previous cycles
- The 2021 recovery was faster (480 days vs the 2–3 year average) — possibly because institutional infrastructure accelerated the bottom formation. The same may be true here.
Long-term holders continue accumulating, ETF flows remain supportive, and post-halving supply dynamics still favor long-term scarcity despite recent volatility.
The macro headwinds are real — the Fed's pause on rate cuts at 3.5%–3.75% provides no fresh liquidity catalyst, while uncertainty around Jerome Powell's May 2026 term expiration and elevated geopolitical tensions have triggered risk-off flows into traditional assets rather than crypto. These are genuine headwinds that didn't exist in the same form during previous cycles.
But institutional involvement also means that when macro conditions improve — rate cuts, regulatory clarity, risk-on sentiment — the structural demand through ETF channels is already built and waiting.
The Three Scenarios (Honestly)
Rather than one prediction, here's what the data supports as genuine possibilities:
Scenario A: Shallower Cycle (Base Case ~40%)
The institutional shift compresses the drawdown, similar to how the 2021 cycle recovered faster than prior ones. Bitcoin finds its low somewhere between $50,000–$60,000, forms a base through Q3–Q4 2026, and begins recovering toward new highs in 2027.
Supporting data: <cite index="18-1">Bitcoin already tested $60,000 and bounced back. This recovery from lower levels suggests underlying strength, with strong buyer support and a higher-lows pattern suggesting accumulation may be beginning.
Scenario B: Historical Pattern (Moderate Probability ~35%)
The cycle plays out closer to historical averages. Bitcoin grinds lower toward $45,000–$55,000 through late 2026, forming a bottom over several months of consolidation before recovering in 2027–2028.
Supporting data: Historically, recovering to the previous ATH takes longer than the drawdown itself, averaging 643 days (21 months) from the bottom.
Scenario C: Severe Correction (~25%)
Macro conditions deteriorate sharply — continued Fed tightening, ETF outflows, geopolitical shock. Bitcoin tests the $30,000–$40,000 zone, a 70%+ drawdown more in line with historical maximums. Recovery timeline extends to 2028–2029.
Supporting data: Options market uncertainty shows traders assigning roughly equal odds to vastly different outcomes — mid-2026: $70K or $130K; year-end 2026: $50K or $250K — suggesting professionals are preparing for large swings in either direction rather than betting on a clear trend.
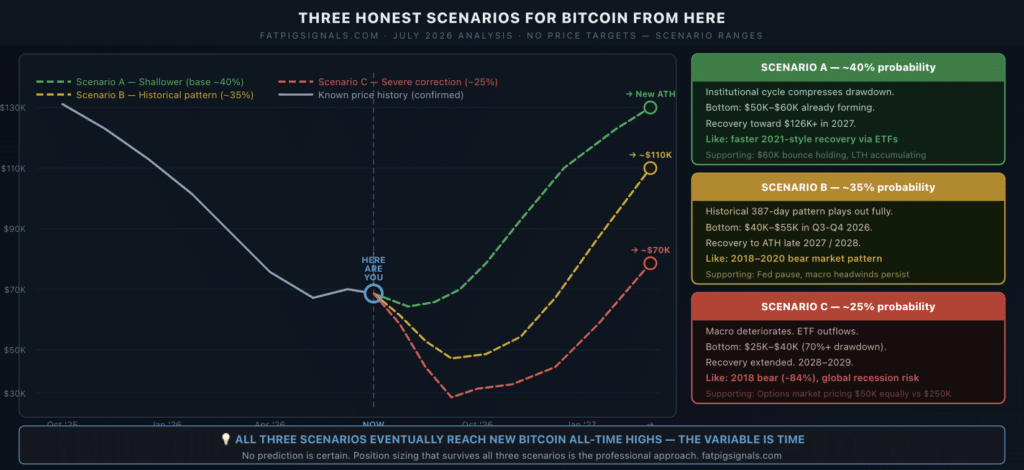
The honest conclusion: Anyone who tells you they know which of these plays out is selling you certainty that doesn't exist. The data gives you ranges and probabilities. What you do with your capital depends on your time horizon, risk tolerance, and whether your position sizing allows you to survive all three scenarios.
What Experienced Traders Are Actually Doing
Not predicting. Positioning.
The traders and investors who survive Bitcoin cycles aren't the ones who correctly called the bottom. They're the ones who built a system before the drawdown started and executed it consistently regardless of how uncomfortable the process felt.
Three things worth noting about current market conditions:
1. Fear readings historically signal accumulation opportunities. The Fear & Greed Index at 26 is not a buy signal — it's context. Historically, the periods of extreme fear in Bitcoin's cycles have been the windows where long-term holders accumulated the most. The May 2020 crash, the June 2022 bottom, the November 2022 FTX collapse — all registered extreme fear. All proved to be accumulation windows in hindsight.
2. DCA removes the timing problem entirely. The single biggest risk in a correction isn't picking the wrong direction — it's picking the wrong moment. Investors can navigate near-term volatility by using common portfolio management methods such as dollar cost averaging, regular rebalancing, and maintaining a long-term investment horizon. Our DCA and Portfolio Builder guide covers exactly how to structure this.
3. Leverage is lethal in this environment. 50% drawdowns with high leverage are account-ending events. A 50x leveraged long position on Bitcoin from the ATH would have been fully liquidated by a 2% move, let alone a 50% one. The leverage guide explains why professionals cap at 2x–5x — it's the only approach that survives a correction of this depth without liquidation.
The traders most at risk right now aren't the long-term holders who bought and are sitting through the correction. They're the leveraged traders who can't wait for the recovery because their positions are getting stopped out, and the emotional traders making reactive decisions based on daily price action rather than any longer-term framework. See our guide on how to avoid revenge trading if that last sentence sounds familiar.
Quick Recap
Here's the honest data summary:
- BTC ATH: $126,198 (October 6, 2025)
- Current price: ~$63,000 (July 13, 2026)
- Current drawdown: ~50% — 7th largest in Bitcoin's history, but mild by historical standards
- Historical context: Every prior drawdown of 50%+ was eventually followed by recovery to new all-time highs
- Historical maximum drawdowns: -93%, -85%, -84%, -77% — current -50% may have further to go
- Average days to bottom: 387 — we're at ~257 days, statistically in the zone of prior lows
- Average recovery from bottom: 643 days to new ATH
- Institutional difference: ETF infrastructure and longer-horizon capital may compress the timeline vs. prior cycles
- Three scenarios: Shallower recovery (base case), historical pattern, or severe correction — all remain plausible
- What experienced traders do: DCA through the cycle, manage leverage carefully, avoid reactive emotional decisions
Your Next Steps
If you're holding long-term: The data supports patience. Every prior drawdown of similar depth eventually resolved to new highs for investors with sufficient time horizon and position sizing that didn't force selling at the worst moment. Review whether your position sizing allows you to hold through a potential further decline without liquidation or panic.
If you're actively trading: This is precisely the environment where structured signals with defined entries, stop losses, and risk management matter most. Trying to call the bottom with heavy leverage in a 50% drawdown environment is one of the top 10 mistakes traders make in corrections.
If you're considering starting: Read the DCA Portfolio Builder guide before doing anything. The worst thing a new investor can do in a drawdown is either panic or bet everything on a single entry. A structured accumulation approach removes both risks.
The Fat Pig Signals free Telegram group has been operating through every Bitcoin cycle since 2017 — the 2018 crash, the 2020 COVID collapse, the 2022 FTX catastrophe, and now this. Full results including the current market period are on the signal results page.
Join the free Fat Pig Signals Telegram → See the full track record since 2017 →
Nobody rings a bell at the bottom. But understanding where we are in the cycle — honestly, with real data, without price target clickbait — is how serious traders make better decisions than the crowd.
Disclaimer: This article is for informational and educational purposes only and does not constitute financial advice. Cryptocurrency investments involve substantial risk of loss. Historical market patterns do not guarantee future results. All price scenarios presented are speculative. Always conduct your own research and consult a qualified financial professional before making investment decisions.
Related Articles

Investing in cryptocurrency for dummies: the ultimate guide

Crypto Trading Basics: A Beginners Guide to Order Types