Understanding Bitcoin Price Charts?
Trading
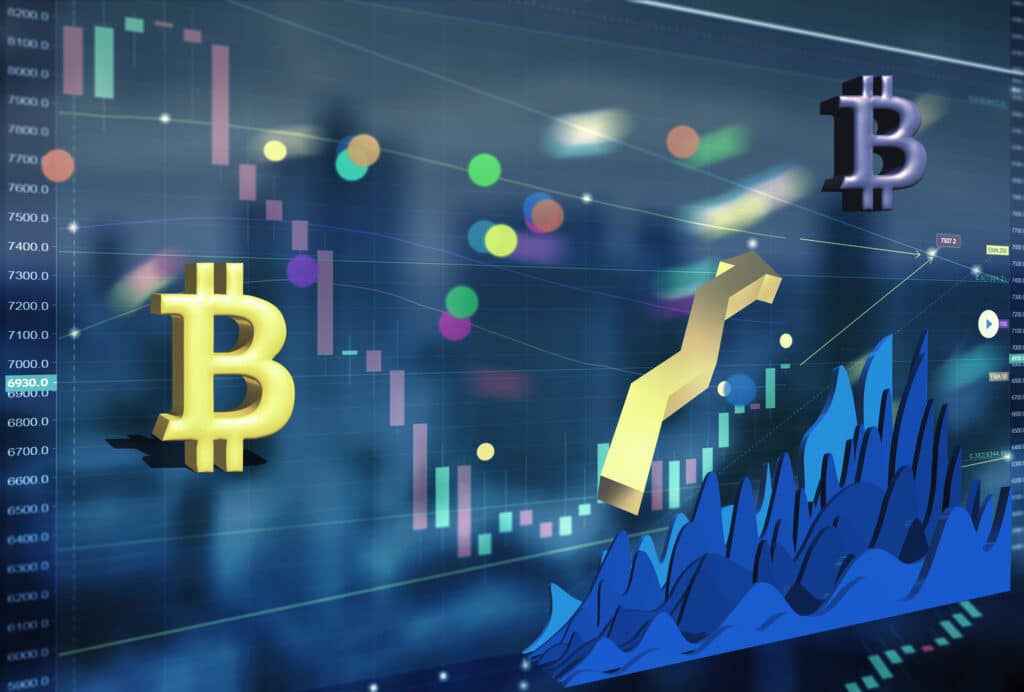
Like technical charts that help investors buy commodities and shares, bitcoin price charts help understand when to put or call bitcoins. A bitcoin chart is a graphical representation of historical volume, price, and time intervals. This chart forms patterns based on the past price movements on bitcoin and assists in finding investment opportunities.
Whether you own bitcoin or planning to buy, sooner or later, you'll need to learn how bitcoin price charts work. However, understanding the financial world and trading terms can be daunting for most people – especially beginners. Don't worry. We'll take it slow and start with the Japanese candlestick chart.
What Are Bearish and Bullish Bitcoin Trends?
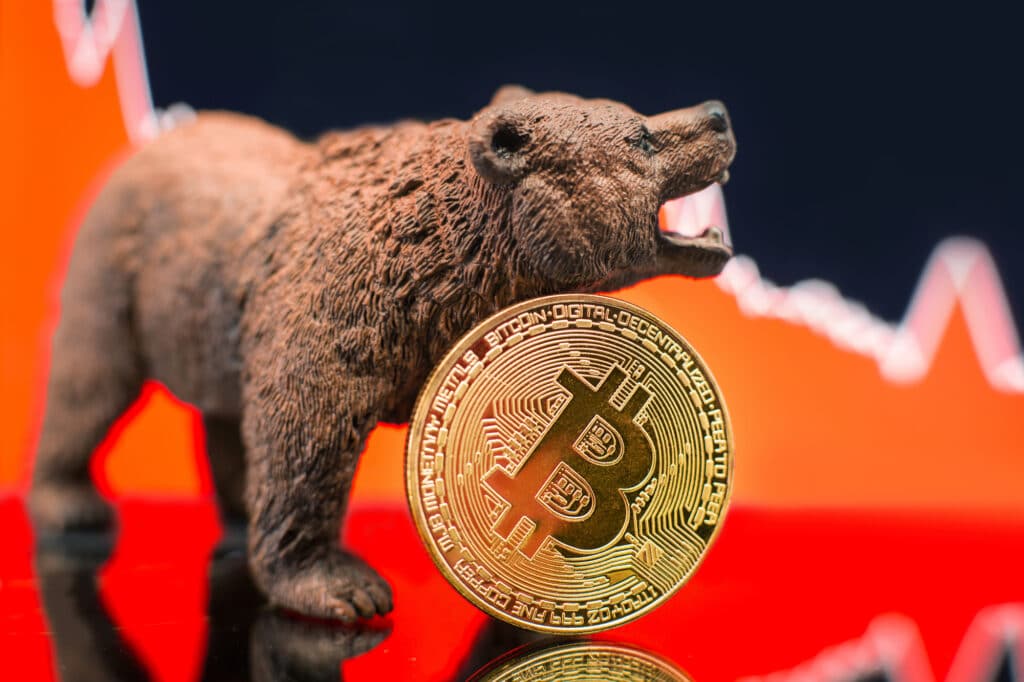
Bearish and bullish are two market positions that form during a specific trading period. Bullish refers to the rise in the price of an asset where the sellers are selling their holdings and buyers are willing to buy. Conversely, a bearish market is where the asset's price starts falling because the prices have reached their all-time high.
Investors buy bitcoin when the market is in a bearish trend, meaning the prices are falling. In contrast, investors sell their bitcoins when the market is bullish because the number of buyers is higher than the seller during this trend. As a result, the demand is higher than the supply, resulting in higher prices. In a bearish market, sellers are higher than buyers, which means supply is more than demand. Consequently, prices start falling.
Japanese Candle Stick Chart
The Japanese candlestick is the most commonly used bitcoin price indicator while trading. To understand it, you must know that the candle in red represents the decrease in the closing price. Conversely, the candle in green represents the price increment when the trading day ends. The size of both red and green candles represents the increase and decrease in the asset's price.
Traders adjust their strategies based on how the market performed during a specific period. For instance, if the market closed at a high price for 3-4 consecutive days, it means the asset price is bound to fall. However, the bitcoin market is highly volatile, and no one can predict what will happen. Therefore, a substantial part of bitcoin investment is based on assumption and experience.
In addition, the bitcoin price chart is susceptible to political changes and market news. For instance, when the US treasury announced bitcoin's involvement in funding terrorism, it hurt bitcoin's price. Similarly, when the government launches an initiative to support bitcoin, its price dramatically increases.
Bearish and Bullish Patterns
The Japanese candlestick forms several patterns, and it's your job as a bitcoin trader to understand where the market is headed with the help of these patterns. The two main patterns formed on the candlestick chart are bullish reversal and bearish reversal patterns.
The bullish reversal patterns indicate that the asset's price will increase after it reaches its market end. The bearish reversal pattern indicates the prices will fall after hitting their all-time high.
A hammer candle pattern is a bullish reversal pattern. It's followed by a small candle with a hammerhead and a long wick, which shows that the seller is driving the prices low. According to the law of demand, when the prices are, demand increases.
As a result, the bullish reversal pattern results in a bearish pattern where the market starts climbing. This might seem simple to identify, but it's not that easy. Therefore, investors observe the bullish reversal pattern for days before buying assets. Moreover, the bullish reversal pattern always occurs when the asset reaches its all-time low (near the end).
Shooting Star Candle Pattern
The shooting star candle pattern is also called the bearish reversal pattern. The market is bound to fall during this trend because buyers are met with resistance. It's indicated by a small candle body with a longer upper wick. The shooting star candle pattern indicates that the market price of an asset has reached its upper limit, and investors are ready to sell their holding for profit.
Head and Shoulder Patterns
The head and shoulder is the most unpredictable pattern of the candlestick chart- especially for bitcoin prices. This pattern can form either at the bottom or the top of an ongoing trend. Therefore, investors keenly follow bitcoin trends before cashing on an opportunity in the head and shoulder pattern.
When the candle aligns in a way that represents the head and two shoulders, it means the market will either take a huge hit or witness a massive spike. Investors with years of experience in the bitcoin price charts can make a profit in the head and shoulder candlestick pattern.
Wedges
Wedges are more accessible to spot in the candlestick chart than the head and shoulder pattern. Wedges follow the rule of "what goes up must come down." For instance, if you notice two consecutive ups, the next move would be down. Likewise, the next move will be up when you find two consecutive downs.
Support and Resistance
Support and resistance are the most important factors for the bitcoin price chart technical analysis. These two thresholds represent bitcoin's maximum highs (resistance) and lows (support). At the support level, sellers outnumber buyers and vice versa for the resistance level. Therefore, these two points are formed, and all candlestick patterns help investors find profitable opportunities.
Takeaway
Bitcoin is a volatile market, and its prices depend on several external factors. What's good about crypto investment is that there aren't any internal factors influencing prices. This is because cryptocurrency is decentralized. As a result, technical analysis is the best approach to trading bitcoins. However, you must be an expert in reading bitcoin price charts. Otherwise, you'll end up making wrong decisions and lose more than what you'll make. Go through the above information until you completely understand how bitcoin price charts work. See if you can spot any patterns in historical graphs.
Related Articles
How to Read Crypto Charts for Beginners

Step-by-Step Guide to Yield Farming for Beginners