Market Sentiment Analysis: Fear & Greed Index Explained
Trading
Ever notice how the market sometimes behaves like a completely different person overnight? One day everyone’s celebrating all-time highs, posting rocket emojis, and telling you to “just buy the dip”—and the next day, the same market collapses by 3–5%. Suddenly everyone acts like the apocalypse is here.
Most beginners feel overwhelmed because price movements often seem irrational. But markets aren’t driven only by data. They’re driven by people—and emotions drive people. Once you understand those emotions, the chaos starts making sense.
Fear & Greed Index is one of the simplest yet most powerful tools for reading the emotional temperature of the market—and once you learn how to decode it, you’ll never look at price action the same way again.
And speaking of decoding… let’s start with the basics so the rest of the story flows naturally.
What Exactly Is the Fear & Greed Index?
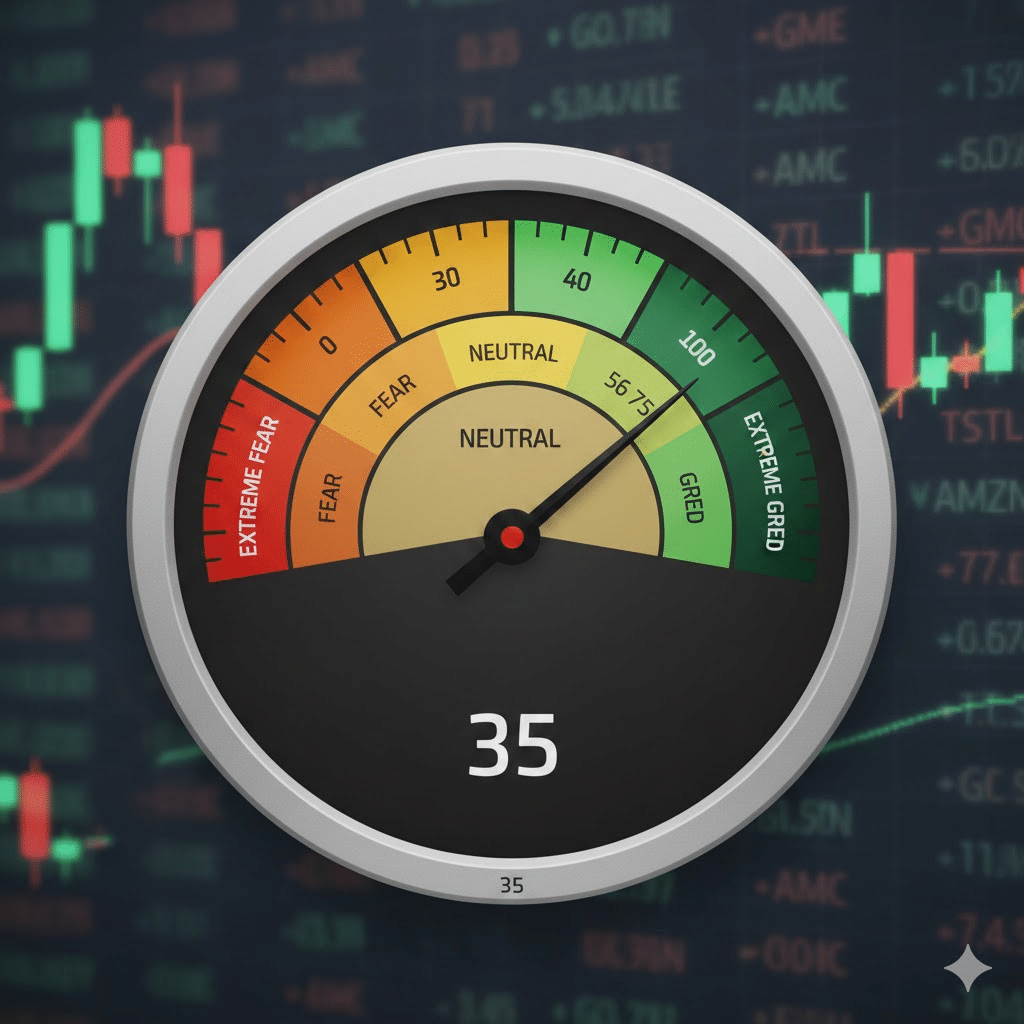
The market is like a giant crowd. Some days, the crowd is anxious and selling everything they can. Other days, it’s euphoric and buying without thinking. The Fear & Greed Index measures that crowd’s emotional state on a scale of 0 to 100, where:
- 0–24 = Extreme Fear
- 25–44 = Fear
- 45–55 = Neutral
- 56–75 = Greed
- 76–100 = Extreme Greed
A useful analogy. Imagine the market as a car.
- Fear = slamming the brakes
- Greed = flooring the accelerator
- Neutral = cruising smoothly
This single number is created by combining multiple market indicators into one unified sentiment reading—kind of like taking seven different vital signs and delivering one health score.
To visualize it simply, picture this mental chart:
| Sentiment Zone | Market Behavior | Trader Mindset |
| Extreme Fear | Overselling, panic | “Get me out!” |
| Fear | Caution, hesitation | “I don’t trust this…” |
| Neutral | Balanced | “Let’s see what happens.” |
| Greed | Aggressive buying | “I don’t want to miss out!” |
| Extreme Greed | Overconfidence | “This can only go up!” |
Now that the concept is grounded, it’s time to meet the components that build this emotional thermometer…
The Key Components of the Fear & Greed Index
The Index is built from seven major indicators, each measuring a different angle of market psychology. Here’s what they represent—and why they matter:
1. Market Momentum (S&P 500 vs. 125-day moving average)
If the market is consistently above its average, buyers are confident. Below the average? That’s a sign of growing fear.Momentum shows whether the market is speeding up or slowing down emotionally.
2. Stock Price Strength (52-week highs vs. lows)
This measures how many stocks are breaking highs versus sinking to lows.
More highs = greed.
More lows = fear.
Real-world example: During a broad market panic, even strong companies suddenly hit new lows.
3. Stock Price Breadth (rising vs. falling volume)
This checks whether most investors are buying or selling on any given day. When volume flows into falling stocks, fear dominates.
4. Put/Call Ratio (options sentiment)
More put buying = fear.
More call buying = greed.
Options traders tend to act before retail traders—so this indicator often signals sentiment shifts early.
5. Market Volatility (VIX Index)
Higher VIX = fear.
Lower VIX = calm or confidence.
The VIX is often called the “fear gauge”—for good reason.
6. Safe-Haven Demand (stocks vs. bonds)
When investors flee stocks and seek bonds, fear is rising. But when stocks outperform bonds, the market is in a risk-on, greedy mood.
7. Junk Bond Demand (yield spreads)
Smaller spread = greed (investors willing to take risks).
Wider spread = fear (investors demand safety).
Together, these indicators create a balanced emotional reading of the market. Now that you know the players, let’s explore how the whole system works together behind the scenes…
How the Fear & Greed Index Actually Works
Let’s break this down simply—because once you understand the mechanics, using the index becomes second nature.
Step-by-Step Process
- Each indicator is measured daily.
- Each is converted into a 0–100 score, depending on how extreme the reading is compared to its historical norms.
- All seven scores are averaged equally.
- The final number becomes the daily Fear & Greed Index.
A helpful visual analogy: Imagine seven friends rating the market’s mood on a scale of 1 to 100. The final score is their average.
But now that you know how it works, the next big question is…
The Hidden Traps: Misconceptions & Manipulative Patterns
This is where beginner traders often slip up. The Fear & Greed Index is powerful, but only if you use it correctly. Here are the most common mistakes:
1. “Extreme Fear Means I Should Buy Immediately!”
Not always.
Extreme fear can get worse before it gets better.
It signals panic—but it doesn’t tell you when the panic will end.
Pro Tip: Use extreme fear as a watch signal, not an automatic entry.
2. “Extreme Greed Means Sell Everything Now!”
Selling too early can make you miss continuation rallies. Greed can stay high for weeks before reversing.
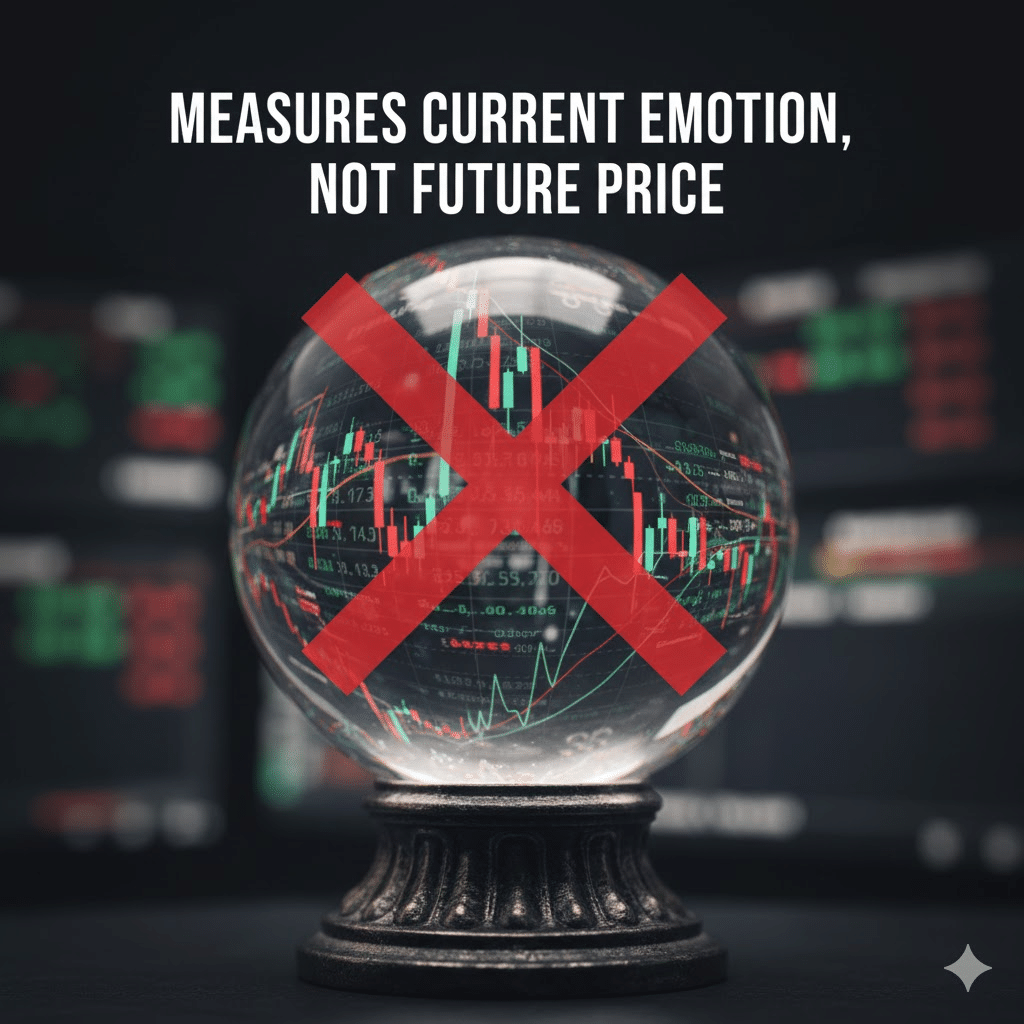
3. Thinking It Predicts the Future
It doesn’t. It measures the current emotional state, not tomorrow’s price direction.
4. Relying Only on the Index
Sentiment is powerful—but incomplete alone. Pair it with:
- trend analysis
- technical levels
- volume
- macro news
5. Ignoring Context
A score of 45 in a bull market feels different from 45 after a crash. Always zoom out and understand the environment.
Now that you know what not to do, let’s look at how to read meaningful patterns…
Recognizing Sentiment Patterns & Signals
Here are the most valuable signals the Index can give:
1. Sudden Drops Toward Fear
This can hint that:
- a correction is accelerating
- news-driven panic is brewing
- a buying opportunity may be forming soon
2. Gradual Rise Toward Greed
This usually reflects:
- sustained optimism
- strong market trends
- higher risk of overheating
3. Sideways Neutral Readings
Neutral zones (45–55) often signal:
- market indecision
- consolidation
- preparation for a bigger move
4. Extreme Zones as Turning Points
Extreme levels often precede:
- mean reversion
- short-term bounce (from fear)
- pullback (from greed)
5. Sentiment Divergence
When price rises but sentiment weakens, it may hint at:
- exhaustion
- bullish weakness
- upcoming correction
Now that you can read the signs, it’s time to learn how to actually use the index to improve your decision-making…
Protect Yourself: Smarter Decision-Making Strategies
Here’s how beginners—and even pros—use the Fear & Greed Index to avoid emotional traps:
1. Apply a Contrarian Mindset (with Caution)
“Be fearful when others are greedy…” isn’t a meme—it reflects a psychological truth.
Use this approach carefully:
- Extreme fear zones → prepare for possible entry
- Extreme greed zones → prepare to reduce exposure
2. Combine It With Technical Levels
Sentiment + support/resistance is extremely powerful.
Example:
- Extreme fear at a key support → high-probability rebound
- Extreme greed at major resistance → high-probability rejection
3. Use DCA During High Fear
Dollar-cost averaging reduces emotional decision-making.
During fear:
- Invest gradually
- Avoid catching falling knives
- Position yourself for eventual recovery
4. Control Position Size
Sentiment reflects volatility. The more fear, the more risk.
5. Always Use Stop Losses
Especially when greed is high—because that’s when corrections hit hardest.
6. Watch for News Catalysts
Sentiment shifts often arrive before major headlines.
Now let’s look at what advanced traders do differently…
Advanced Strategies for Experienced Traders
If you want to level up your market intuition, here’s how pros combine sentiment with deeper analysis:
1. Sentiment + Momentum Confirmation
Pros wait for momentum to align with sentiment before acting.
Example:
- Extreme fear + rising momentum = potential reversal setup
- Extreme greed + momentum loss = early warning sign
2. Multi-Timeframe Sentiment Analysis
Weekly sentiment often shows deeper emotional cycles than daily readings.
3. Using the Index for Market Timing
It won’t predict exact tops or bottoms, but it helps identify exhaustion.
4. Pairing the Index With Volatility Tools
Combining Fear & Greed with the VIX can create powerful early alerts.
5. Tracking Divergences
When sentiment rises but price stalls, or vice versa, pros prepare for reversals.
Quick Recap
Here’s your rapid summary:
- Markets are driven by emotion—fear and greed shape price action.
- The Fear & Greed Index measures market mood on a 0–100 scale.
- Seven indicators combine to reveal whether the crowd is cautious or euphoric.
- Extreme zones often signal potential turning points.
- Mistakes include using it alone or thinking it predicts the future.
- Use it with trends, key levels, and proper risk management.
- Advanced traders look for divergence, momentum shifts, and emotional cycles.
Conclusion & Next Steps
The market will always swing between fear and greed—just like people. But now you’re no longer reacting blindly to those emotional waves. You can read them.
Your next steps:
- Today: Check the current Fear & Greed Index and compare it to recent price action.
This Week: Observe how different news events impact sentiment spikes.
Ongoing: Pair the index with technical analysis and practice spotting patterns before they become obvious.
If you want real-time guidance on how fear and greed are shifting, FatPigSignals tracks sentiment changes and market psychology daily so you always know when investors are panicking—or overconfident. Join our community to get actionable signals based on live sentiment data and stay ahead of emotional market swings.
Disclaimer: This article is for educational purposes only and does not constitute financial advice. Always do your own research and consult a licensed professional before making financial decisions.
Related Articles

Crypto Trading Strategies You Should Know

How to Sell Bitcoin – Crypto Trading