How to Read Volume Profile for Crypto Trading Signals
News, Signals, Trading
Have you ever watched Bitcoin's price suddenly shoot up or crash down and wondered, "Why did it stop right there?" Maybe you've seen the price bounce off the same level three times in a row and thought it was magic—or just luck.
Here's the thing: it's neither. There's a tool that shows you exactly where traders are most active, where big money is flowing, and where price is likely to bounce or break through. It's called the Volume Profile, and it's one of the most powerful (yet beginner-friendly) tools you can add to your crypto trading toolkit.
Most beginners only look at price charts—the candles going up and down. But price alone tells you what happened. Volume Profile tells you where traders actually put their money. That's a game-changer.
In this guide, you'll learn:
- What Volume Profile actually is (explained simply, no PhD required)
- The key parts of a Volume Profile and what they tell you
- How to spot high-probability trading signals using volume zones
- Practical strategies you can start using this week
What Is Volume Profile? (Think of It Like a Popularity Contest for Prices)
Let's start simple. Imagine a busy farmers' market. Some stalls have long lines—everyone wants to buy there because the price feels "fair." Other stalls are nearly empty because the prices are too high or the products aren't interesting.
Volume Profile works the same way for crypto. It's a chart tool that shows you which price levels attracted the most trading activity (the busy stalls) and which ones traders ignored (the empty stalls).
Here's how it's different from the regular volume bars you might already see on your chart. Normal volume bars sit at the bottom of your chart and tell you how much was traded during a time period—like an hour or a day. But they don't tell you at what price all that trading happened.
Volume Profile flips things sideways. It displays horizontal bars along the price axis, showing you the volume traded at each specific price level. The longer the bar, the more trading happened at that price. The shorter the bar, the less interest traders had at that level.
Why does this matter for crypto? Because prices tend to behave predictably around these zones. They slow down and bounce around busy levels, and they race through quiet ones. Once you can see these patterns, you can start making smarter decisions about when to enter and exit trades.
💡 Pro Tip: Think of high-volume areas as magnets—prices get pulled toward them. Think of low-volume areas as slippery floors—prices slide right through them.
The Key Parts You Need to Know
Don't worry—you don't need to memorize a textbook. There are really only four things you need to understand on a Volume Profile chart. Let's break each one down.
Point of Control (POC)—The "Fair Price"
The Point of Control (POC) is simply the price level where the most trading volume occurred. It's the single longest bar on the Volume Profile histogram.
Think of it like the most popular item at a store—it's the price where the most buyers and sellers agreed to do business. In crypto, the POC often acts like a magnet. When prices drift away from it, they tend to get pulled back—especially on calm, range-bound days.
What this means for your trading: If Bitcoin is trading near its POC, the market is in "fair value" territory. Don't expect big moves. If the price is far away from the POC, watch for it to either build a new fair value zone or get pulled back.
Value Area (VA)—Where 70% of the Action Happens
The Value Area is the price range where roughly 70% of all volume was traded. It has two edges: the Value Area High (VAH) at the top and the Value Area Low (VAL) at the bottom.
Here's a simple way to think about it: the Value Area is like the "comfort zone" of the market. Most traders feel okay buying and selling within this range. When price moves outside this zone, things get interesting—and sometimes volatile.
What this means for your trading: The VAH often acts as resistance (a ceiling where price struggles to break above), and the VAL often acts as support (a floor where price tends to bounce). These aren't random lines—they're based on where actual money changed hands.
High Volume Nodes (HVN)—The Busy Zones
High Volume Nodes are price areas where a LOT of trading happened. They show up as thick, wide bars on the profile. These zones tend to slow price movement down because there's so much activity and liquidity there.
Imagine driving through a crowded city center—you're going to slow down. That's what price does at HVNs. These areas can act as strong support or resistance because many traders have positions at these levels.
Low Volume Nodes (LVN)—The Empty Hallways
Low Volume Nodes are the opposite—price levels where very little trading occurred. These appear as thin, narrow gaps on the profile. Traders sometimes call them "air pockets."
What this means for your trading: If you see a price heading toward an LVN, expect speed. If you see it approaching an HVN, expect it to slow down or bounce.
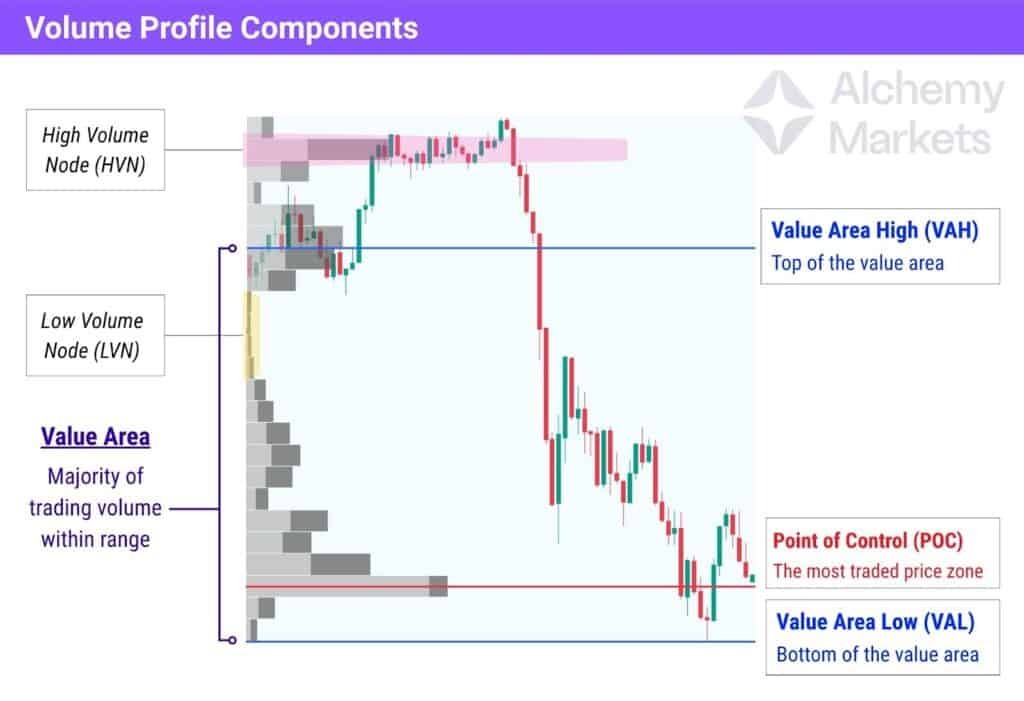
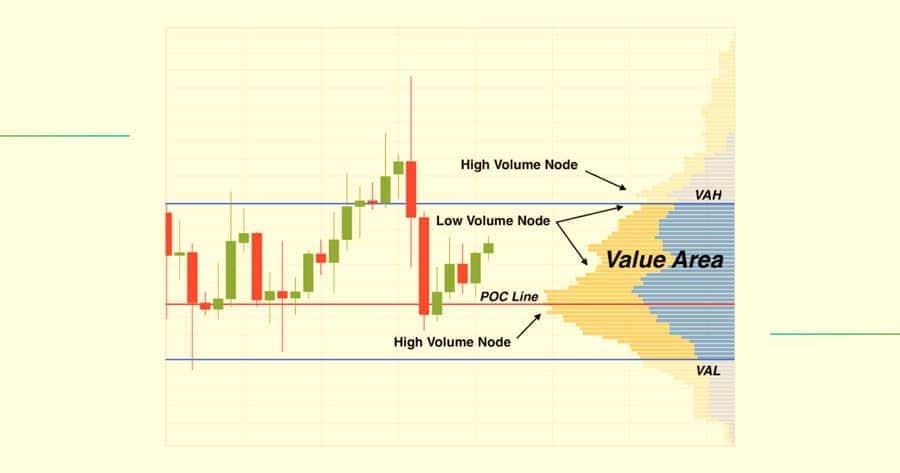
An Illustration showing the different parts of the Volume Profile. Image Source: AlchemyMarkets
Three Volume Profile Signals That Actually Work
Now for the part you've been waiting for—how to turn all of this into actual trading signals. These aren't guaranteed winners (nothing in trading is), but they're patterns that many experienced traders use to find higher-probability setups.

An Illustration showing the Value Area Bounce Trade. Image Source: Tradingview
Signal 1: The Value Area Bounce (Rotation Trade)
What to look for: Price drops to the Value Area Low and then starts to bounce back up. Or price rises to the Value Area High and starts to fall back down.
Why it works: The market is telling you it's comfortable within this range. When price reaches the edge and gets pushed back, it often rotates all the way back toward the POC—or even the opposite edge.
How to use it: If Bitcoin drops to the VAL and you see buying start to pick up (the price stops falling and candles start turning green), this could be a signal to go long with a target near the POC. Always set a stop loss (an automatic sell order to limit your loss) just below the VAL in case the bounce fails.
⚠️ Common Mistake: Don't blindly buy every time price touches the VAL or sell every time it touches the VAH. Wait for confirmation—look for the price to actually start reversing before you jump in. If it blasts straight through, the signal is invalid.

An Illustration showing the Low-Volume Breakout (Traverse Trade). Image Source: Do Net Tutorials
Signal 2: The Low-Volume Breakout (Traverse Trade)
What to look for: Price approaches a Low Volume Node—one of those thin, empty areas on the profile—with momentum and committed buying or selling.
Why it works: Since very few traders transacted at these levels before, there's little resistance to stop the price from moving through quickly. It's like a ball rolling down a hill with no obstacles.
How to use it: When you see price approaching an LVN with strong candles, expect it to move fast through that zone until it reaches the next High Volume Node. Your target would be that next HVN. These trades can be quick—price often reaches the target faster than normal setups.
Important: These can look scary because you might be buying near a local high or selling near a local low. But the speed at which these play out can make them worthwhile.
An Illustration showing the Value Area Breakout. Image Source: Opofinance
Signal 3: The Value Area Breakout (Discovery Trade)
What to look for: Price breaks decisively above the VAH or below the VAL and stays there—it doesn't immediately fall back inside.
Why it works: When price escapes the comfort zone and holds, it signals that the market is accepting new price levels. Fresh buying or selling interest is building, and a new value area may form.
How to use it: If Bitcoin breaks above the VAH and the next few candles close above it, this is a potential continuation signal. Traders often look for the breakout to be accompanied by higher-than-average volume. If volume is weak during the breakout, be careful—it could be a fakeout (a false breakout that quickly reverses).
Our Fat Pig Signals community on Telegram often discusses these breakout setups in real time, helping members spot the difference between genuine breakouts and traps before committing capital.
Putting It All Together: A Simple Daily Routine
You don't need to spend hours staring at charts. Here's a quick process you can follow each day:
- Before you trade: Look at yesterday's Volume Profile. Note where the POC, VAH, and VAL are. Mark any obvious LVNs between high-volume clusters.
- At the open: Watch whether price opens inside or outside yesterday's Value Area. Inside suggests rotation (expect bounces between edges). Outside suggests a potential trending day.
- During the session: Ask one question: "Is the market accepting new prices or rejecting them?" If new volume is building at new levels, it's acceptable. If price keeps getting pulled back to old levels, it's rejecting.
- Before entering: Wait for confirmation. A level is just a level until price actually reacts to it. Don't trade in "no man's land"—the middle of the Value Area where there's no clear signal.
💡 Pro Tip: Keep a simple trading journal. After each session, write down whether the Volume Profile correctly identified the key bounce and breakout levels. Over time, you'll see how reliable these zones are and build confidence in your reads.
Quick Recap
Here's what we covered:
- Volume Profile shows volume by price, not by time—it reveals where traders actually put their money
- The Point of Control (POC) is the most-traded price—it acts like a magnet for price on range days
- The Value Area contains 70% of volume—its edges (VAH and VAL) serve as dynamic support and resistance
- High Volume Nodes slow price down—expect consolidation and bouncing near these zones
- Low Volume Nodes let price fly through—expect fast moves through these thin areas
- Three reliable signals: Value Area bounces, LVN traverses, and VA breakouts give you structured, high-probability trade ideas
The bottom line? Volume Profile takes the guesswork out of finding key levels and turns your chart into a map of where traders actually care about price.
Your Next Steps
1. Today: Open your charting platform (TradingView offers a free version of Volume Profile tools) and pull up a daily Bitcoin chart with the Volume Profile overlay. Just look at it. Notice where the thick and thin bars are. Get familiar with the visual.
2. This Week: Practice identifying the POC, VAH, and VAL on each day's chart. Watch how price reacts when it reaches these levels. Don't trade yet—just observe and take notes.
3. Ongoing: Once you're comfortable reading the profile, start paper trading (practicing without real money) the three signals we covered. Track your results. When you see consistent patterns, consider applying them with small, real positions. And join the Fat Pig Signals Telegram community where we share chart analysis, discuss key volume levels, and help each other navigate the markets together.
Remember: every pro trader started exactly where you are right now. Volume Profile might look unfamiliar at first, but give it a week of practice and you'll wonder how you ever traded without it. Take it one step at a time, keep your risk small while you learn, and trust the process. You've got this.
Disclaimer: This article is for educational purposes only and should not be considered financial advice. Cryptocurrency trading involves substantial risk of loss. Always do your own research and consider consulting with a financial advisor before making investment decisions.
Related Articles

Altcoin Roundup: 3 Metrics Traders Can Use to Analyze DeFi Tokens

The 8 Golden Rules Of Crypto Trading