What Is Order Flow? The Hidden Force Behind Every Crypto Price Move
Trading
Have you ever entered a trade that looked perfect on the chart — only to watch the price do the exact opposite the moment you clicked buy?
The chart said go. Everything looked right. And still, it went the wrong way.
Here's what most beginner traders don't know: price charts only show you what already happened. They're a record of the past. What actually moves the price right now is something happening beneath the surface — something called order flow.
Once you understand order flow, you stop feeling like you're guessing. You start seeing the forces behind price movement. And while it won't make trading perfectly predictable (nothing does), it gives you an edge that most retail traders simply don't have.
In this article, you'll learn what order flow is, why it matters in crypto, the key tools you can start watching today, and how professional traders use this information to make smarter decisions.
What Is Order Flow and Why Does It Matter?
Order flow is simply the real-time stream of buy and sell orders being placed and executed in the market at any given moment.
Think of it like this. Imagine a busy fish market. The price of fish doesn't go up because someone drew a line on a chart. It goes up because suddenly fifty buyers showed up and only three fishermen were selling. The demand — the flow of buyers — is what drives the price.
Crypto markets work exactly the same way. Every price movement happens because someone is buying or selling right now. Order flow lets you see that activity as it unfolds.
Why does this matter for your trading? Because traditional technical indicators — things like RSI, moving averages, and MACD — are all built from historical price data. By the time they signal something, the move may have already happened.
Order flow, by contrast, shows you current market activity. Not what happened. What's happening?
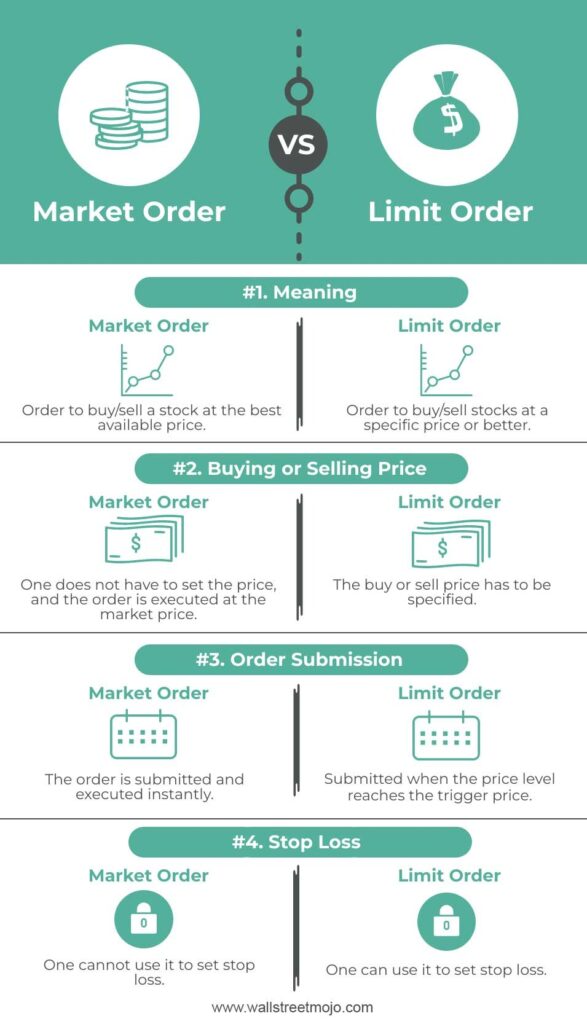
An illustration showing the 2 types of Orders. Image Source: WallstreetMojo
The Two Types of Orders You Need to Know
Everything in order flow comes down to understanding two types of orders.
Limit orders are passive. A trader says, "I want to buy Bitcoin at $95,000 — if it gets there, fill my order." That order sits in the order book, waiting. Limit orders create liquidity in the market.
Market orders are aggressive. A trader says, "Buy me Bitcoin right now at whatever the best available price is." Market orders execute immediately and consume the liquidity that limits orders created.
Here's the key insight: market orders move price. Limit orders create the walls that either hold or break.
When aggressive buyers keep hitting the ask (the sell side) over and over, price pushes upward. When aggressive sellers keep hitting the bid (the buy side), price pushes downward.
Order flow is essentially tracking this battle in real time — asking the question: who's more aggressive right now, buyers or sellers?
💡 Pro Tip: You can think of limit orders like stacked shopping carts blocking a door. Market orders are the people aggressively pushing through them. If the carts are heavy enough (big enough limit orders), the door holds. If the pushers are strong enough, they break through.
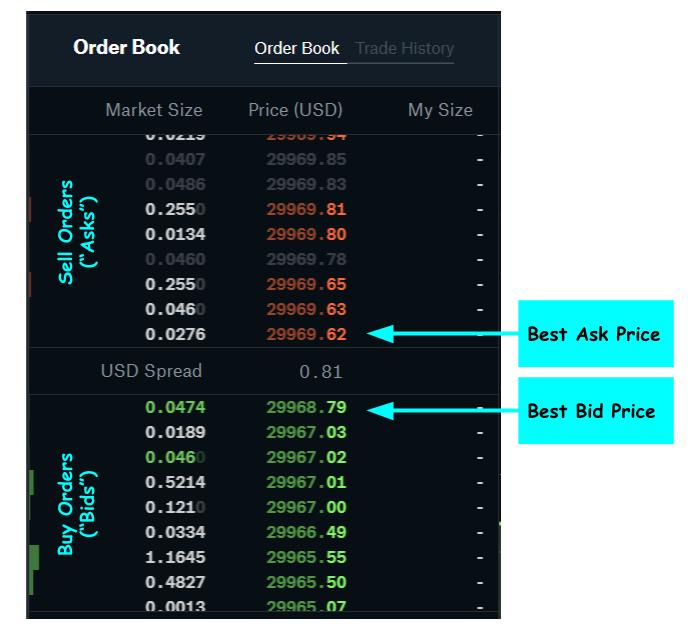
An Illustration showing the Order Book. Image Source: BabyPips
The Order Book: Your Window Into Real-Time Supply and Demand
The order book — also called the Depth of Market (DOM) — is the most direct way to see order flow in action.
It shows you all the pending buy orders (bids) and sell orders (asks) sitting in the market right now, organized by price level. The higher the number of orders at a price level, the more "weight" that level carries.
When price approaches a level with a huge cluster of buy orders, there's a good chance it might bounce there — because all those buyers are waiting to absorb any sellers who push down that far.
When price approaches a large cluster of sell orders, it might stall — because all those sellers are ready to absorb any buyers trying to push higher.
One important caution: not every large order you see in the order book is genuine. Some traders place large "fake" orders to mislead the market — this is called spoofing. They create the impression of strong support or resistance, then pull the order before price gets there.
The lesson? Don't blindly trust large visible orders. Watch whether they actually absorb trades or disappear the moment price approaches.
⚠️ Common Mistake: New traders see a huge sell wall in the order book and immediately assume the price can't break through. Sometimes that wall disappears just as price arrives, leaving surprised traders caught on the wrong side. Always wait for the market to prove a level holds — don't assume it.
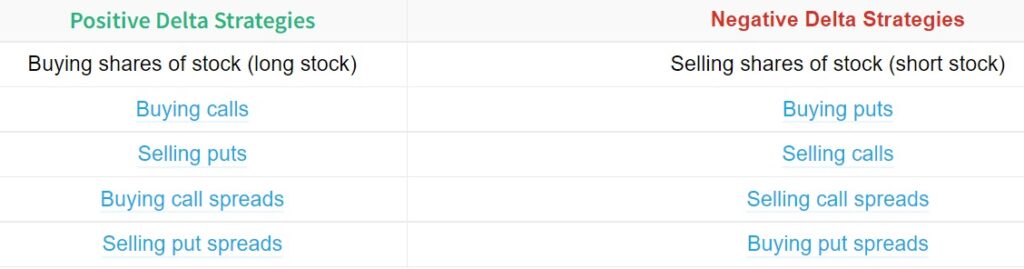
An Illustration showing the difference between Positive and Negative Delta Strategies. Image Source: ProjectFinance
Delta: The Scoreboard of Buying vs. Selling Pressure
If the order book is the battlefield, delta is the scoreboard.
Delta is the difference between the volume of aggressive buy orders and aggressive sell orders over a given period.
- A positive delta means more aggressive buying happened — buyers were hitting the ask, driving the price up.
- A negative delta means more aggressive selling happened — sellers were hitting the bid, pushing price down.
Here's where it gets useful: sometimes price and delta tell different stories, and that's where trading opportunities appear.
Let's say Bitcoin is making new all-time highs, but the delta is actually decreasing — meaning fewer aggressive buyers are stepping in at those new highs. That's a warning sign. The price is going up, but the buying conviction is fading. A reversal might be coming.
Or imagine price is dropping hard, but delta stays neutral or even turns positive. That tells you aggressive sellers are losing steam — buyers are starting to absorb the selling pressure. A bounce could be forming.
This concept is called delta divergence, and learning to spot it is one of the most useful skills an order flow trader can develop.
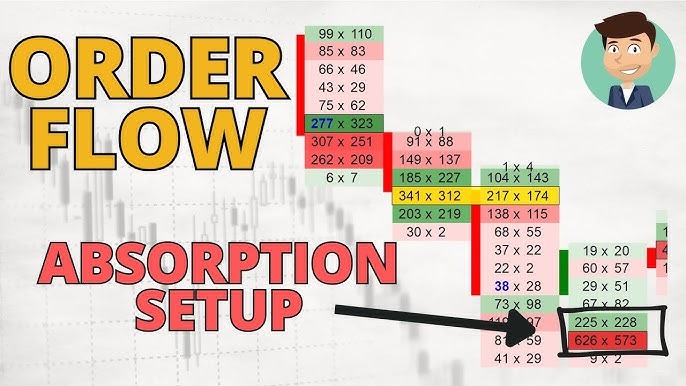
A Youtube Video explaining the Absorption Setup in Order Flow. Image Source: Youtube
Absorption: When the Market Holds a Level Under Pressure
One of the most powerful concepts in order flow is absorption.
Absorption happens when a lot of aggressive orders flood one side of the market — but price barely moves. That means big limit orders on the opposite side are quietly soaking up all that aggression.
Here's a real-world analogy: imagine someone punching a boxing bag as hard as they can. If the bag barely swings, it means the bag is very heavy — or someone is holding it still from the other side.
In trading, if sellers are hammering price at a support level but price just isn't falling, it suggests a large buyer is sitting there absorbing every sell order. Once sellers exhaust themselves, the large buyer is fully positioned — and price often launches upward.
This is why you'll sometimes see price bounce sharply from a level after it seemed to be under sustained selling pressure. The absorption was happening the whole time. You just couldn't see it on a regular candlestick chart.
Absorption is best spotted using footprint charts — specialized charts that show exactly how much volume traded at each price level inside every candle, broken down by buy and sell side.
Volume Profile: Where Are the Most Trades Happening?
Another essential order flow tool is the Volume Profile.
A volume profile shows you how much trading activity occurred at each price level over a chosen period. Instead of just seeing that "a lot of volume happened today," you can see where — which specific prices attracted the most buyers and sellers.
The key levels to know:
Point of Control (POC) — The price level where the most volume traded. This acts like a magnet for price. Markets tend to return to the POC repeatedly because it represents the price where buyers and sellers most agreed on value.
High Volume Nodes (HVNs) — Price ranges with heavy trading activity. These often act as support and resistance zones because so many participants were active there.
Low Volume Nodes (LVNs) — Price ranges with barely any trading history. When price enters these zones, it tends to move fast — there's no historical "friction" to slow it down. These are useful for setting take-profit targets.
Think of the volume profile like an x-ray of the market. The standard price chart shows the surface. The volume profile shows what's underneath — where all the real activity was concentrated.
How to Start Applying Order Flow: A Beginner's Approach
You don't need to master every order flow tool at once. Here's a realistic starting path for beginners:
Start with a volume profile. This is the most accessible tool and is available on most trading platforms. Before entering any trade, ask: is this price in a high-volume zone (likely to slow down) or a low-volume zone (likely to move fast)?
Add delta awareness. Many platforms show cumulative delta at the bottom of the chart. Start noticing whether price and delta are moving together or diverging. If they're telling different stories, slow down.
Watch for absorption at key levels. When price approaches a significant support or resistance zone, does it stall and hold despite heavy pressure? Or does it break straight through? Absorption suggests the level is defended. Clean breaks suggest the level is not.
Use order flow as confirmation, not as your main signal. Don't replace your entire strategy with order flow overnight. Instead, when your existing analysis says a trade might be good, check the order flow. Does it confirm the idea? Or does it show warning signs?
Quick Recap
Here's what you've learned today:
- Order flow is the real-time stream of buy and sell orders — it's what actually moves price, not charts
- Limit orders create liquidity and form support/resistance walls; market orders consume that liquidity and drive price
- The order book (DOM) shows pending orders — but beware of spoofing (fake orders designed to mislead)
- Delta is the score of buyers vs. sellers — divergence between price and delta is a powerful warning signal
- Absorption happens when big orders quietly soak up aggressive pressure — often a sign a reversal is coming
- Volume Profile reveals where the most trading activity happened, highlighting high- and low-friction zones
- Use order flow as confirmation, layered on top of your existing analysis — not as a replacement for it
Your Next Steps
Order flow is a skill that builds with screen time and practice. Here's how to start building it this week:
1. Today: Open a chart and add the Volume Profile indicator (available on TradingView and most platforms). Identify the Point of Control on the last trading day. Notice whether price has been respecting or ignoring that level.
2. This week: Watch how price behaves at key support and resistance levels. Instead of just noting that price stalled, ask yourself why — was there visible buying absorption? Did the order book show heavy bids at that level? Start developing the habit of asking "what's the order flow story here?"
3. Ongoing: Before every trade, add one order flow check to your routine. Is delta confirming the move? Is volume light or heavy at this price zone? Even a simple 30-second check will start to sharpen your instincts over time.
Remember: professional traders don't just read charts. They read markets. Order flow is how you start reading the market, not just the picture it paints.
Join the Fat Pig Signals Telegram community to see how experienced traders interpret order flow in real time, discuss what the market is showing, and sharpen your skills alongside traders who take this seriously.
[Join our Telegram group here]— and start seeing what's actually moving crypto prices.
Every great trader started by learning something that changed how they saw the market. Today, that something was order flow.
Disclaimer: This article is for educational purposes only and should not be considered financial advice. Cryptocurrency trading involves substantial risk of loss. Always do your own research and consider consulting with a financial advisor before making investment decisions.
Related Articles

How to Sell Bitcoin – Crypto Trading

The Key Indicator That Makes It Easier for Buying the Dip