How to Stack the Odds in Your Favor Using Technical Confluence
Cryptocurrencies, Signals
You've been staring at the chart for twenty minutes. The RSI says oversold. It looks like a buy. You go in.
Then the price drops another 15%.
Sound familiar? If so, you're not alone — and it's not your fault. Most beginners make the same mistake: they pick one tool, trust it completely, and wonder why it keeps letting them down.
Here's the truth: no single indicator works on its own. The traders who actually make consistent money don't pick the "best" indicator. They combine the right indicators together to confirm what they're seeing. This is called technical confluence — and it's one of the most powerful concepts you can learn as a beginner.
By the end of this article, you'll understand what confluence means, which tools to combine and why, and how to build a simple checklist that helps you take only the trades with the highest chance of working out.
What Is Technical Analysis (And Why Does It Matter)?
Before we get into confluence, let's quickly cover the basics.
Technical analysis is the study of price charts to make trading decisions. Instead of looking at a company's earnings reports or Bitcoin's adoption news, technical traders focus purely on what the price is doing right now — and what patterns suggest it might do next.
The theory behind it is simple: price reflects everything. All the news, all the opinions, all the fear and greed in the market — it all shows up in the chart. So if you can learn to read the chart, you can read the market.
Technical analysis includes things like support and resistance levels, trend lines, candlestick patterns, and mathematical indicators. You don't need to master all of them. But you do need to understand how they work together.
The Four Building Blocks You Need to Know
Think of technical analysis like a courtroom. One witness is not enough to convict. You need multiple sources of evidence pointing to the same conclusion before you're confident enough to act.
Here are the four main types of evidence at your disposal:
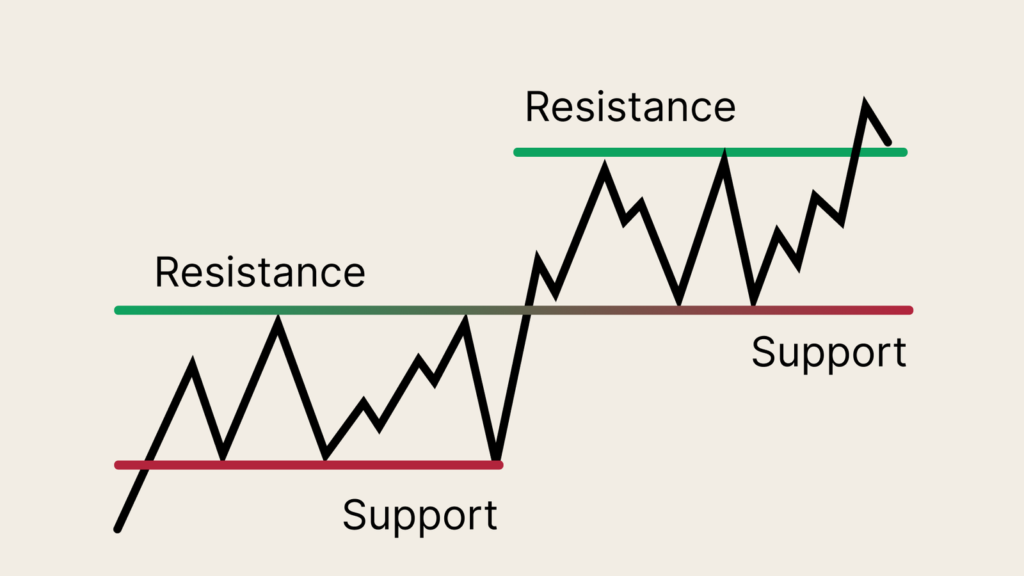
An Illustration showing the Support and Resistance level in Crypto Trading. Image Source: Equiti
1. Support and Resistance — The "Floor and Ceiling" of Price
Support is a price level where the market has repeatedly bounced upward. Think of it like a trampoline — when price falls to that level, buyers step in and push it back up.
Resistance is the opposite — a price level where the market has repeatedly been rejected. Like a ceiling, every time price tries to climb above it, sellers push it back down.
These levels matter because they show where demand and supply have historically been strongest. If Bitcoin has bounced from $90,000 three times in the past two months, that $90,000 level is significant. When price approaches it again, you know something could happen there.
💡 Pro Tip: The more times a level has been tested and held, the more powerful it becomes. A support level that has held four times is far more significant than one that's only held once.
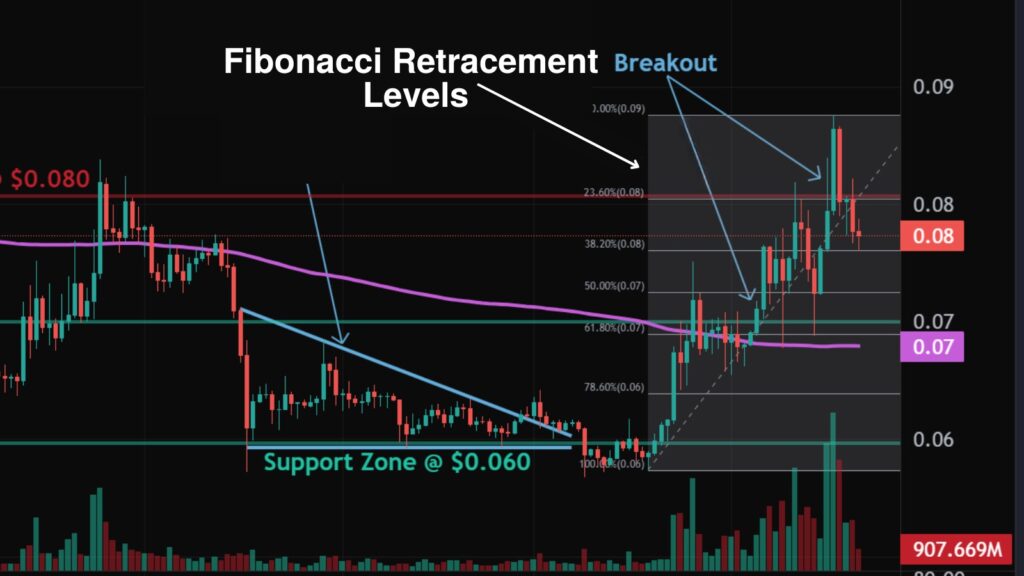
An Illustration showing the Fibonacci Retracement Levels. Image Source: altFINS
2. Fibonacci Retracements — Where Price Likes to Pause
When a crypto asset makes a big move — say, Bitcoin rallies from $80,000 to $100,000 — it rarely goes straight up. It pauses, pulls back a little, then continues.
Fibonacci retracements help you predict where those pullbacks are likely to stop. The tool is based on a mathematical sequence discovered centuries ago that appears throughout nature, art, and financial markets.
The key retracement levels are 38.2%, 50%, and 61.8%. These are the zones where price most commonly pauses or reverses during a pullback.
Here's a practical example: Bitcoin runs from $80,000 to $100,000 — a $20,000 move. The 38.2% retracement sits at approximately $92,360. The 61.8% sits around $87,640. These are the zones where smart traders watch for buying opportunities if they missed the initial breakout.
On its own, a Fibonacci level is just a number. But combined with a support level, a candlestick signal, or a momentum indicator? It becomes a high-probability trade zone.
An Illustration showing the different Candlestick Patterns. Image Source: Medium
3. Candlestick Patterns — The Market's Body Language
Every candle on a chart tells a story. The size of the body, the length of the wicks — all of it reveals information about the battle between buyers and sellers within that time period.
The most important candlestick for beginners to learn is the pin bar (also called a hammer or shooting star depending on the direction).
A bullish pin bar has a small body near the top and a long wick pointing downward. It tells you: sellers pushed the price way down during this candle — but buyers stepped in aggressively and pushed it all the way back up before the candle closed. That's a sign of strong buying pressure.
A bearish pin bar is the opposite — price was pushed up, but sellers slammed it back down. A sign of strong selling pressure.
On their own, pin bars appear frequently and aren't always reliable. But a pin bar forming at a support level or at a Fibonacci retracement zone? That's the market giving you a clear signal — two pieces of evidence pointing in the same direction.
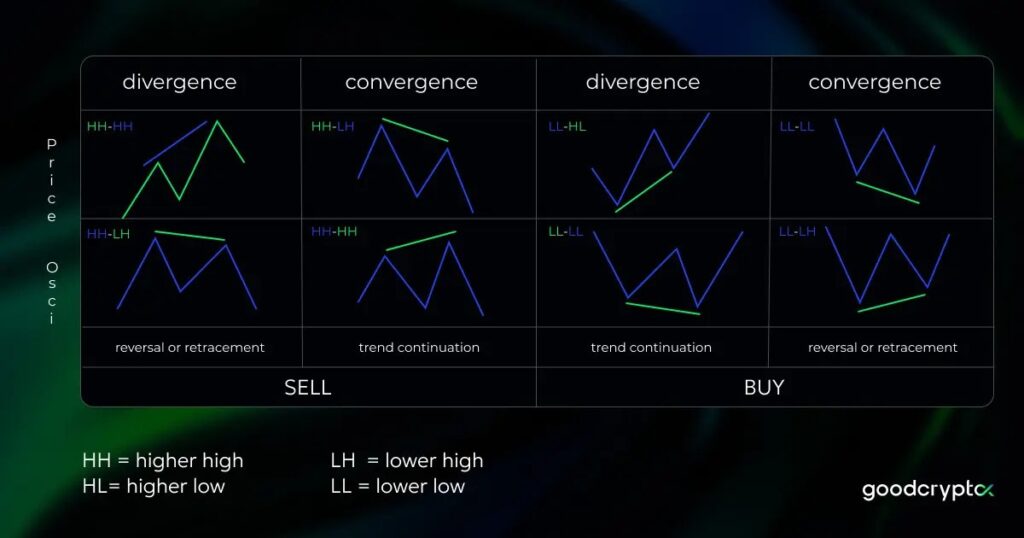
An Illustration showing the RSI. Image Source: goodcrypto
4. The RSI — Reading the Market's Momentum
The RSI (Relative Strength Index) is a momentum indicator that moves on a scale from 0 to 100. It measures how fast and how strongly price is moving.
Here's what the numbers tell you:
- Above 70 = the market may be overbought. Buyers have pushed price up aggressively, and it may be due for a pullback.
- Below 30 = the market may be oversold. Sellers have pushed price down aggressively, and a bounce may be coming.
- Around 50 = neutral, no strong momentum in either direction.
But the most powerful RSI signal isn't overbought or oversold — it's RSI divergence.
Bullish divergence happens when price is making lower lows (still falling), but the RSI is making higher lows (not confirming the weakness). This is the market telling you: the downward momentum is fading even though price is still dropping. A reversal may be near.
Bearish divergence is the opposite — price is making higher highs, but the RSI is making lower highs. The upward momentum is running out.
⚠️ Common Mistake: Many beginners use RSI alone and treat every reading below 30 as a buy signal. The problem? In a strong downtrend, RSI can stay below 30 for a long time. An oversold market can keep getting more oversold. Always combine RSI with other signals before acting.
The Secret: Combining Tools, Not Collecting Them
Here's something most beginners get wrong: they add more and more indicators to their chart, thinking more information = better decisions. Then they end up with a screen full of coloured lines that all say different things, and they're more confused than when they started.
This is called indicator redundancy — and it's actually harmful to your trading.
Think about it this way: if you put three momentum indicators on your chart — RSI, MACD, and Stochastic — all three are measuring basically the same thing (momentum). They'll all point in the same direction most of the time. You're not getting more information. You're just seeing the same information three times and feeling more confident than you should.
The goal isn't to have many indicators. The goal is to have indicators from different categories that each measure something unique:
- One trend tool (like a moving average or support and resistance levels)
- One momentum tool (like RSI or MACD)
- One price action signal (like a pin bar or engulfing candle)
When all three of these different types of evidence agree? That's confluence. That's when you pay attention.
Confluence in Action: A Real-World Example
Let's walk through a complete example so you can see exactly how this works.
Imagine Ethereum is in an uptrend. It's been climbing steadily for three weeks. Then it pulls back and starts falling. You're watching for a potential buying opportunity.
Here's your process:
Step 1 — Find the structural level. You look back at the chart and spot a clear support zone at $3,200. Price bounced strongly from this level twice before.
Step 2 — Add Fibonacci. You draw a Fibonacci retracement over the most recent upswing. The 61.8% retracement level sits at $3,185 — almost exactly on your support zone. That's two pieces of evidence already overlapping in the same zone.
Step 3 — Watch for the candle signal. Price approaches the $3,185–$3,200 zone. You watch and wait. A bullish pin bar forms — a long lower wick showing buyers rejecting the move down.
Step 4 — Check the RSI. You look at the RSI and notice bullish divergence — price made a new low on the pullback, but the RSI didn't. Momentum is weakening on the sell side.
Now you have four confluent signals all pointing toward the same thing: support level, Fibonacci zone, pin bar, and RSI divergence. Each one alone would be questionable. Together, they tell a compelling story.
This is how professional traders think. Not "the RSI is low, let me buy." But "I have multiple layers of evidence pointing toward a high-probability bounce from this specific zone."
A Beginner's Confluence Checklist
Before entering any trade, run through this simple checklist:
- Is there a structural level? Identify clear support (for buys) or resistance (for sells) on the chart.
- Does Fibonacci agree? Does a key Fibonacci level (38.2%, 50%, or 61.8%) land near your structural level?
- Does the candle confirm? Is there a pin bar, engulfing candle, or other reversal pattern at the zone?
- Does momentum support it? Is the RSI showing divergence, or at least not contradicting your trade?
If you can check off two or more of these boxes, the trade is worth considering. If you can check off three or four, it's a high-probability setup. If only one box is checked, sit on your hands and wait for better conditions.
Quick Recap
Here's everything you've learned today:
- Technical analysis uses price charts and tools to identify trading opportunities
- Support and resistance show where price has historically found buyers and sellers
- Fibonacci retracements predict where pullbacks are likely to pause or reverse (key levels: 38.2%, 50%, 61.8%)
- Pin bars reveal sharp shifts in market sentiment — especially powerful at key structural levels
- RSI divergence signals fading momentum before price has confirmed the reversal
- Indicator redundancy is the mistake of using multiple tools that measure the same thing
- Confluence is the principle of combining tools from different categories so each adds new evidence
- The more confluent signals that align in the same zone, the higher the probability of the trade working
Your Next Steps
Knowing these tools is only the beginning. Here's how to start applying them:
This week: Open TradingView (it's free) and pick one coin you follow. Draw in the obvious support and resistance levels from the past month. Don't trade yet — just practice identifying where the key levels are.
Next week: Add the Fibonacci retracement tool to your most recent significant price swing. Notice where the key levels land. Do any overlap with your support and resistance zones?
Ongoing: Start a trading journal. Every time you spot a potential setup, write down which confluence factors you see and how many boxes your checklist checks. Over time, patterns will emerge showing which combinations work best for you.
The Fat Pig Signals community doesn't just share signals — we explain the reasoning behind every call so you can learn to identify these setups yourself. If you want to see confluence in action on live markets, join our Telegram group and watch how the analysis unfolds in real time.
[Join the Fat Pig Signals Telegram community here]
The best traders aren't the ones who found a magic indicator. They're the ones who learned to wait patiently for multiple pieces of evidence to line up — and then had the discipline to act when they did.
Disclaimer: This article is for educational purposes only and should not be considered financial advice. Cryptocurrency trading involves substantial risk of loss. Always do your own research and consider consulting with a financial advisor before making investment decisions.
Related Articles

How Traders Can Get Rich With Crypto

What are the new cryptocurrencies to watch: hot insights