Best Timeframes for Crypto Futures Trading (Stop Switching Charts Every 5 Minutes)
News
Search "best timeframe for crypto trading" and you'll get the same answer over and over: "it depends on your personality and schedule."
That's true. It's also useless if you're a beginner who has never traded before and genuinely doesn't know what your "trading personality" even is yet.
Here's the honest version of this article: the timeframe that ruins most beginners isn't the wrong one — it's switching between five different ones in the same afternoon, hunting for whichever chart currently agrees with what they want to believe.
This guide gives you a real starting point, explains exactly what each timeframe is actually good for, and tells you the one decision that matters far more than picking the "best" chart.
What a Timeframe Actually Means
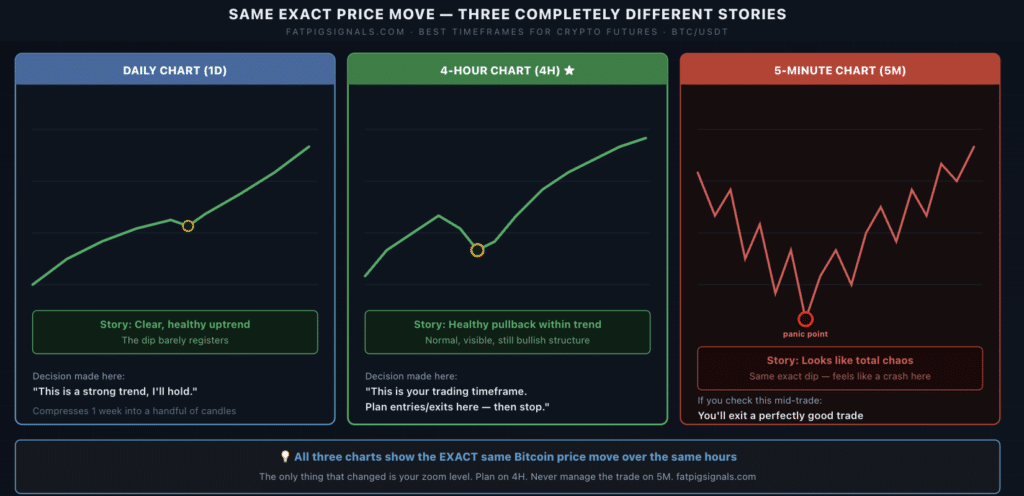
A timeframe determines how much price action gets compressed into a single candle on your chart.
On a 15-minute (15m) chart, each candle shows everything that happened to the price across 15 minutes — the open, the high, the low, and the close for that window. On a daily (1D) chart, each candle compresses an entire 24 hours into the same four data points.
Same price, same market — completely different picture depending on how far you zoom out.
This matters because every timeframe tells a slightly different story about the same asset, and beginners often don't realise they're looking at noise on one chart while ignoring a clear trend visible one zoom-level higher.
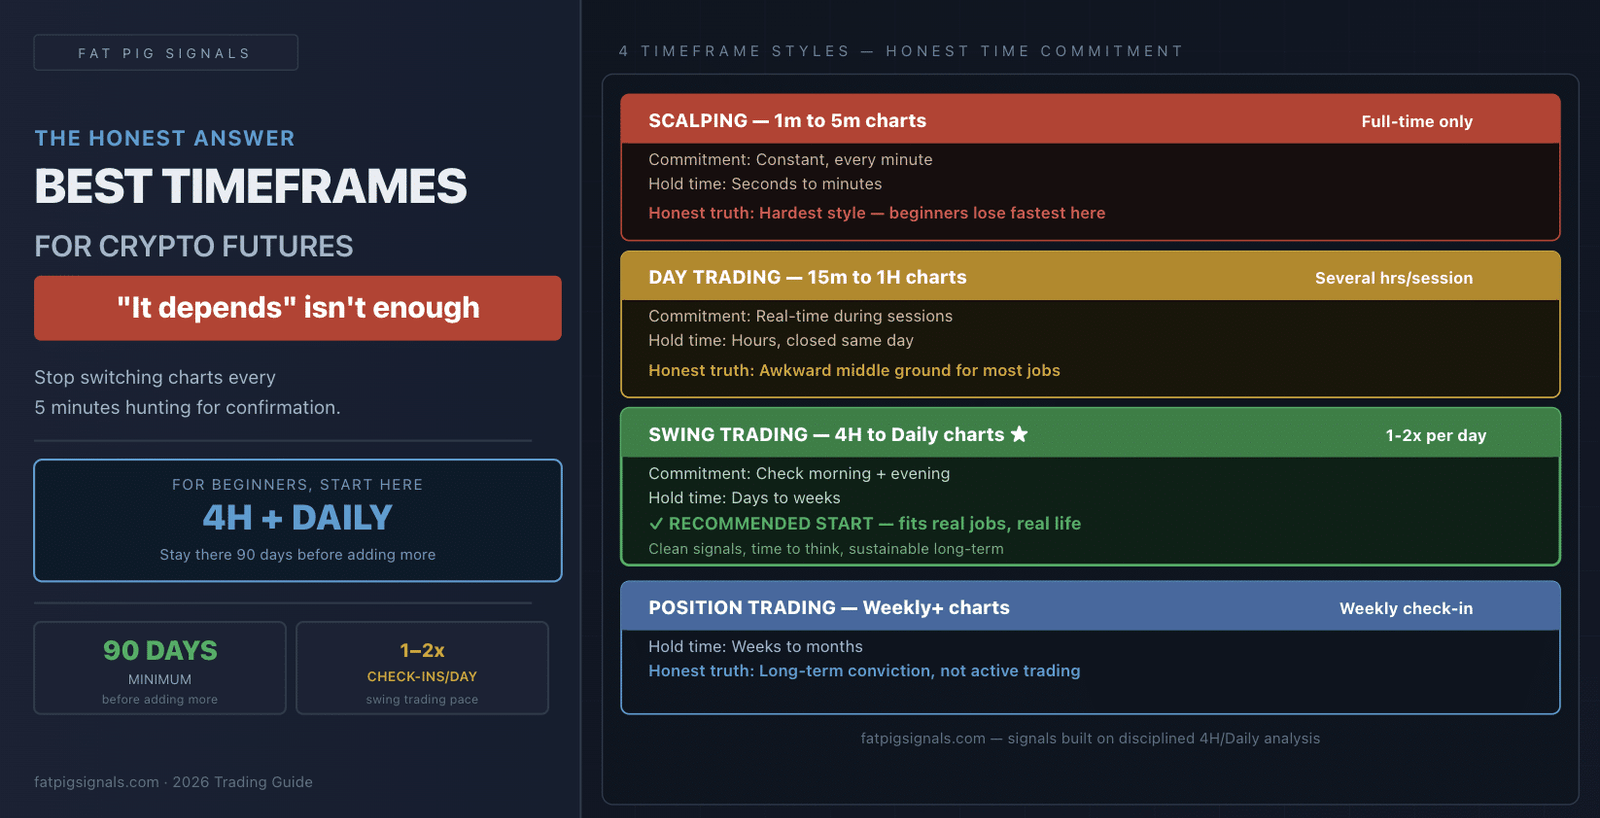
The Four Main Timeframe Categories
Scalping: 1-Minute to 5-Minute Charts
Scalping means entering and exiting trades within minutes, sometimes seconds, trying to capture very small price movements repeatedly throughout a session.
What it requires: Full-time attention. You cannot scalp while at a job, in a meeting, or asleep. Positions need constant monitoring.
The honest truth for beginners: Scalping is widely considered the hardest style to learn, not the easiest. The combination of high leverage (commonly used to make tiny moves meaningful), rapid decision-making, and transaction costs eating into thin margins means new traders typically lose money faster on 1-minute charts than on any other timeframe — not because the strategy is flawed, but because executing it well requires reflexes and discipline that take months to build.
Day Trading: 15-Minute to 1-Hour Charts
Day trading means opening and closing all positions within the same day, avoiding the risk of holding a position overnight when you're not watching the market.
What it requires: Several hours of active attention during the trading session, though not the constant second-by-second focus that scalping demands.
The honest truth for beginners: This sits in an awkward middle ground. It's calmer than scalping but still demands real-time presence — making it genuinely difficult for anyone with a full-time job or inconsistent free time.
Swing Trading: 4-Hour to Daily Charts
Swing trading means holding a position for several days to a few weeks, aiming to capture a meaningful portion of a larger price move rather than minute-by-minute fluctuations.
What it requires: Checking the market once or twice a day — morning and evening works for most people. No need to watch charts continuously.
The honest truth for beginners: This is genuinely the most realistic starting point for most people learning to trade, and not because it's "easier" in some watered-down sense. It's because the 4-hour and daily timeframes filter out a huge amount of meaningless short-term noise, giving you cleaner signals and more time to think before acting — which is exactly what a beginner needs while still building judgment.
Position Trading: Weekly Charts and Beyond
Position trading means holding for weeks to months, focused entirely on the big picture trend rather than any short-term price action.
What it requires: Patience above all else. Checking in weekly is often sufficient.
The honest truth for beginners: This overlaps heavily with long-term accumulation strategies rather than active trading. It's less about reading charts skilfully and more about conviction in a long-term thesis.
The Timeframe Comparison Table
| Style | Timeframe | Time Commitment | Typical Hold | Best Suited For |
|---|---|---|---|---|
| Scalping | 1m–5m | Constant, full-time | Seconds to minutes | Full-time traders only |
| Day Trading | 15m–1H | Several hours/session | Hours, closed same day | Available during market hours |
| Swing Trading | 4H–1D | 1–2 checks per day | Days to weeks | Most beginners, people with jobs |
| Position Trading | 1W+ | Weekly check-ins | Weeks to months | Long-term conviction holders |
Pro Tip: Notice the pattern — as the timeframe gets longer, the time commitment per day shrinks dramatically, but the patience required to sit through normal volatility increases. There's no free lunch here. You're always trading something for something else.
Why "It Depends on Your Personality" Isn't Wrong — But It's Incomplete
Most articles stop at matching timeframe to schedule and temperament, and leave it there. That's genuinely useful — but it skips the actual reason most beginners struggle, which has almost nothing to do with which single timeframe they picked.
The real problem: timeframe switching mid-decision.
Here's what this looks like in practice. A trader pulls up the daily chart and sees a clear uptrend. Feeling confident, they enter a long position. Twenty minutes later, the price dips slightly. They flip to the 5-minute chart — which, naturally, looks completely different and slightly scary, because 5-minute charts always look more dramatic during normal volatility. Panicked by what they're now seeing, they exit a perfectly good trade that the daily chart still fully supports.
This happens constantly, and it has nothing to do with whether daily or 5-minute is the "right" timeframe. The trader made a decision on one chart and then let a completely different chart talk them out of it.
Common Mistake: Switching to a lower timeframe specifically to find a chart that "confirms" you should exit a trade you're already nervous about. If you find yourself doing this, the issue usually isn't the chart — it's that your position size is too large for your comfort level, which no timeframe can fix.
The Multi-Timeframe Approach (Done Correctly)
Using more than one timeframe isn't the problem — using them in the wrong order is.
Professional traders do use multiple timeframes, but in a specific, disciplined sequence:
Step 1: Use a higher timeframe to determine the overall trend. Check the daily or weekly chart first. Is the broader trend up, down, or sideways? This is your context — the "weather," not the moment-to-moment forecast.
Step 2: Use your trading timeframe to find your actual entry. If you're a swing trader, this is your 4-hour chart. You're looking for a specific setup that aligns with the higher-timeframe trend you just identified — not against it.
Step 3: Never use a lower timeframe than your trading timeframe to manage an open position. Once you're in the trade, stop looking at anything more granular than the chart you used to plan it. If you planned a swing trade on the 4-hour chart, monitoring it on the 5-minute chart will only show you noise designed to make you doubt a decision that was already sound.
A maintained ratio that works well for most swing traders: use the daily chart for trend context, the 4-hour for entries, and stop there. Don't add a third or fourth timeframe until you've genuinely mastered using two together.
What Beginners Should Actually Do
Given everything above, here's the practical recommendation — not "it depends," an actual starting point:
Start with the 4-hour and daily charts. Use them together, in that order. Stay there for at least 90 days before adding anything else.
This isn't because 4H/daily is mathematically superior to every other combination. It's because:
- It filters enough noise that you can actually see what's happening
- It demands a realistic time commitment most people can sustain alongside a job or other responsibilities
- It gives you enough time between decisions to think instead of react
- Ninety days is roughly enough time to see a meaningful sample of how your decisions play out — not just one lucky trade or one unlucky one
Once you've genuinely spent 90 days reading 4-hour and daily charts, watching how price respects support and resistance levels, and tracking your own decision-making patterns — that's when adding a third timeframe (like the 1-hour for finer entries) starts to add value instead of adding confusion.
Quick Recap
Here's what we covered:
- A timeframe compresses price action into candles — same market, completely different picture depending on the zoom level
- Four main styles: scalping (1m–5m, full-time only), day trading (15m–1H, several hours/session), swing trading (4H–1D, the realistic beginner starting point), position trading (1W+, long-term conviction)
- "It depends on your personality" is true but incomplete — the bigger beginner problem is switching timeframes mid-decision to chase confirmation
- Multi-timeframe analysis works when ordered correctly: higher timeframe for trend, trading timeframe for entry, and never a lower timeframe to manage an open position
- The practical starting point: 4-hour + daily charts, together, for at least 90 days, before adding anything else
Your Next Steps
Today: Pick your starting timeframe — 4-hour and daily, if you're genuinely undecided. Commit to it on paper, not just mentally.
This week: Practice the two-step sequence: check the daily chart for trend, then the 4-hour for entries. Don't open any other timeframe during this process, even out of curiosity.
When you're ready: Watch how structured signals are built around a specific, disciplined timeframe rather than improvised in the moment. Every signal in the Fat Pig Signals free Telegram group is built on a clear technical basis — not chart-hopping until something looks convincing.
Join the free Fat Pig Signals Telegram →
The traders who struggle most with timeframes aren't using the "wrong" one. They're using five different ones in the same hour, looking for whichever chart tells them what they already want to hear. Pick one. Stay with it. Let it actually teach you something before you move on.
Disclaimer: This article is for educational purposes only and does not constitute financial advice. Cryptocurrency futures trading involves substantial risk of loss. Always conduct your own research and never trade with money you cannot afford to lose.
Related Articles

BBVA's Bold Move: Launching a Visa-Backed Stablecoin by 2025

Fed Rate Cut Expectations Propel Bitcoin Above $108,000