Top 7 Best Indicators for Crypto Trading
Cryptocurrencies
Cryptocurrency trading can feel like navigating a stormy sea. Prices rise and fall in the blink of an eye, and without the right tools, it’s easy to feel lost. That’s where trading indicators come in. These are powerful tools that help you understand market trends, spot opportunities, and avoid costly mistakes.
In this complete guide, we’ll explore the most effective and easy-to-understand indicators used by crypto traders around the world..
What Are Crypto Trading Indicators?
Trading indicators are tools that analyze price data, trading volume, and other market information to help traders make informed decisions. They don’t predict the future, but they do help you understand what’s happening in the market right now — and what might happen next.
These indicators are often shown as lines, bars, or overlays on a price chart. They help answer questions like:
- Is the market going up or down?
- Is this a good time to buy or sell?
- Are we in a strong trend or just moving sideways?
The Psychology Behind Indicators
Before we get into the technicals, it’s important to understand what indicators are really doing. Indicators are not magical predictors — they are mathematical representations of trader behavior. They reflect:
- Fear and greed
- Momentum and hesitation
- Buying and selling pressure
- Market sentiment
Why Use Indicators in Crypto Trading?
Using indicators helps you:
- Make smarter decisions based on data, not emotions
- Spot trends early and ride them for profits
- Avoid false signals and reduce risk
- Time your entries and exits more effectively
Now, let’s explore the top indicators that can help you trade smarter.
1. Moving Averages (MA)
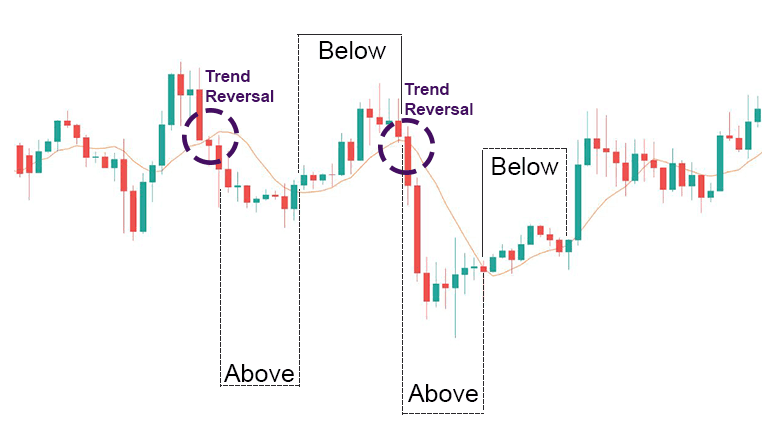
A Moving Average smooths out price data to show the average price over a certain time period. It helps you see the overall direction of the market.
Types:
- Simple Moving Average (SMA) – the average price over a set number of days
- Exponential Moving Average (EMA) – gives more weight to recent prices
Traders often watch these lines closely.
Why It’s Useful:
- Helps identify trends
- Acts as support or resistance
- Easy to use for beginners
Example:
- Price bouncing off the 200-day MA = strong support
- Price breaking below the 50-day EMA = potential trend reversal
2. Relative Strength Index (RSI)
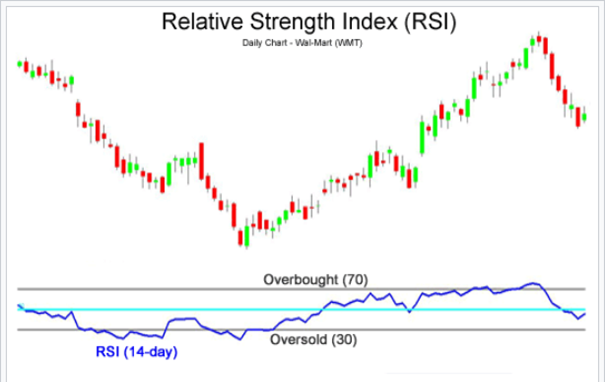
The RSI is a momentum indicator that shows whether a coin is overbought or oversold.
How It Works:
- RSI ranges from 0 to 100
- Above 70 = overbought (price may fall)
- Below 30 = oversold (price may rise)
One of the most powerful ways to use the Relative Strength Index (RSI) is by spotting divergence:
- Bullish Divergence: Price makes lower lows, but RSI makes higher lows → Trend reversal likely
- Bearish Divergence: Price makes higher highs, but RSI makes lower highs → Potential drop ahead
Why It’s Useful:
- Helps spot possible reversals
- Great for timing entries and exits
RSI Zones for Trend Confirmation
- RSI between 40–60: Neutral zone
- RSI above 60: Strong bullish trend
- RSI below 40: Strong bearish trend
This helps you avoid false signals in sideways markets.
Example:
If RSI is 25, the asset may be undervalued and ready to bounce.
3. MACD (Moving Average Convergence Divergence)
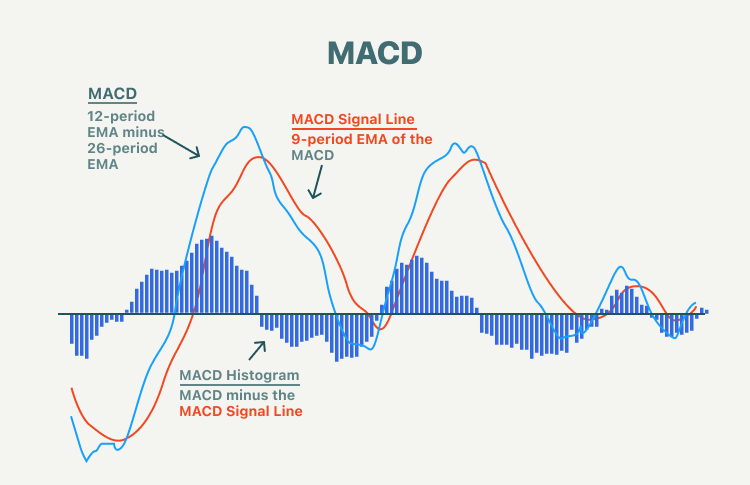
MACD is a trend-following indicator that shows the relationship between two moving averages.
Components:
- MACD Line
- Signal Line
- Histogram
Why It’s Useful:
- Shows trend direction and momentum
- Gives buy/sell signals when lines cross
Example:
When the MACD line crosses above the signal line, it’s a bullish signal.
4. Bollinger Bands
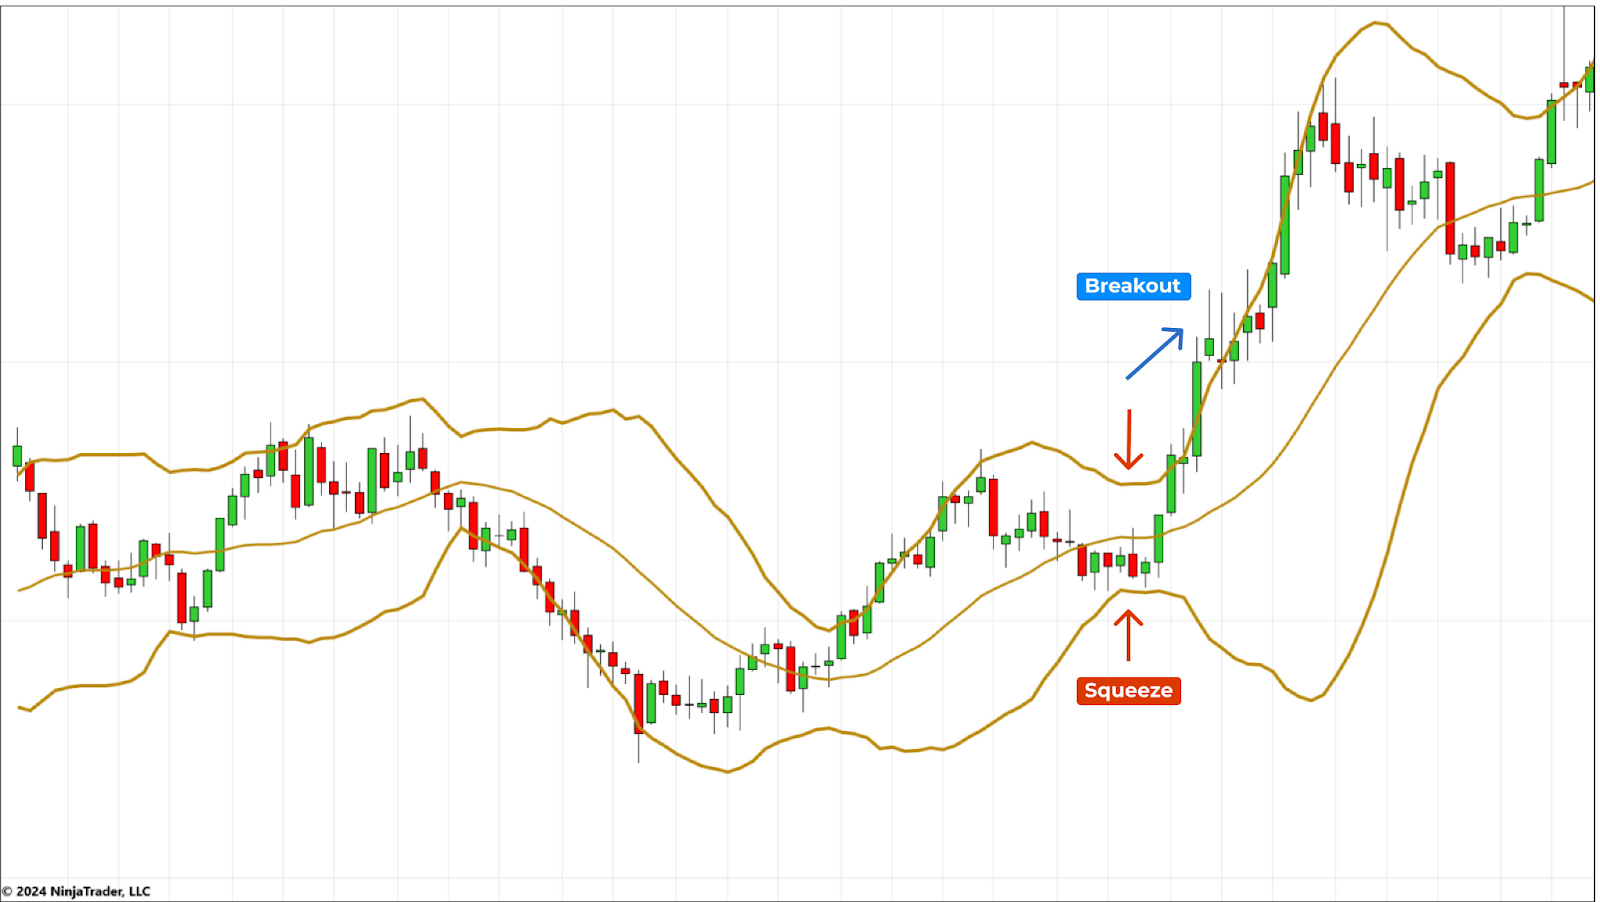
Bollinger Bands are lines plotted above and below a moving average. They show how volatile the market is. The MACD Histogram shows the difference between the MACD line and the signal line. It’s great for spotting early momentum shifts:
- Rising histogram: Bullish momentum increasing
- Falling histogram: Bearish momentum building
Components:
- Middle Band = Moving Average
- Upper & Lower Bands = Standard deviations
Why It’s Useful:
- Helps identify overbought/oversold conditions
- Shows when a breakout might happen
Example:
When MACD crosses above the zero line → Bullish confirmation
When it crosses below → Bearish confirmation
This can be used to confirm the strength of a breakout or breakdown.
5. Volume
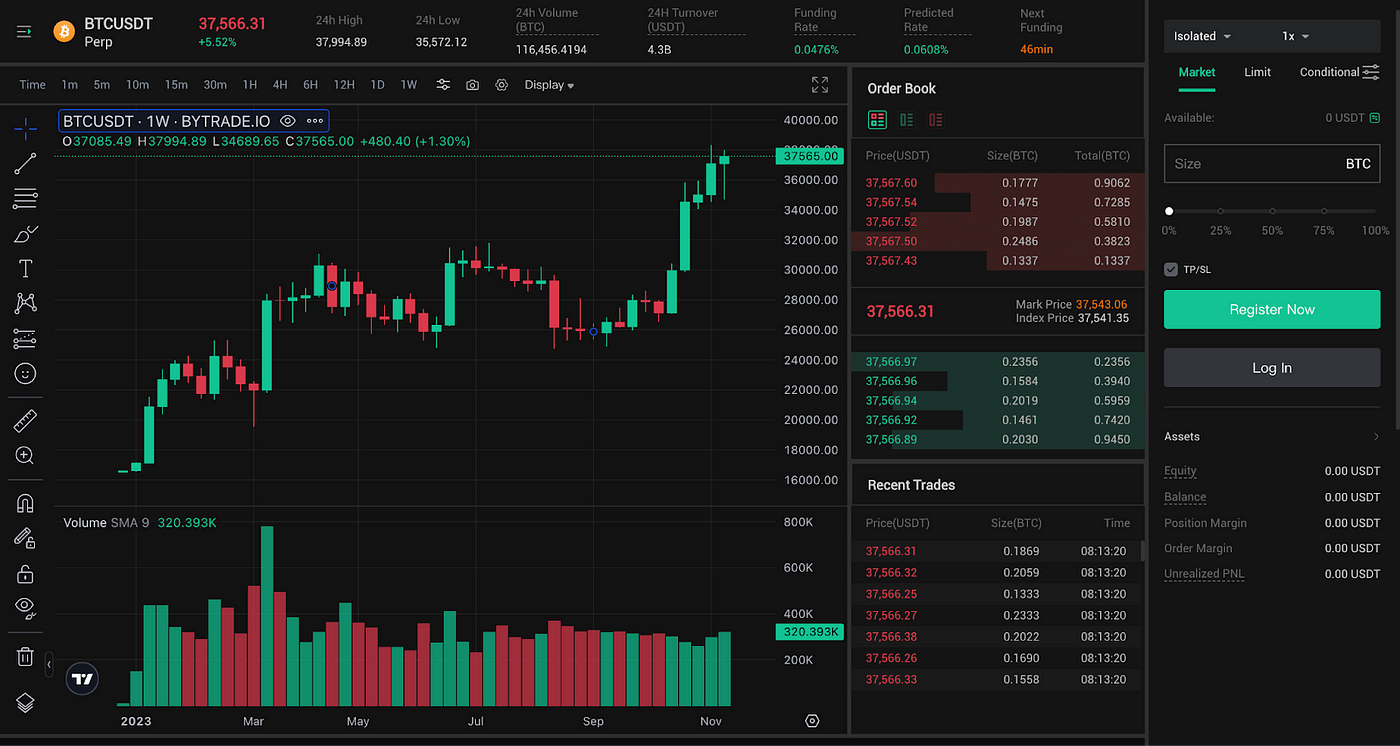
Volume is often overlooked by beginners, but it’s one of the most reliable confirmation tools. Volume shows how much of a coin is being traded. It’s one of the most basic but powerful indicators.
Why It’s Useful:
- Confirms trends
- Helps spot big moves
- Shows interest in a coin
Volume and Breakouts
- High volume + breakout = Strong and reliable move
- Low volume + breakout = Likely to fail (false breakout)
Volume Spikes
- Sudden increase in volume often precedes major price moves
- Look for volume spikes at support or resistance zones
6. Fibonacci Retracement
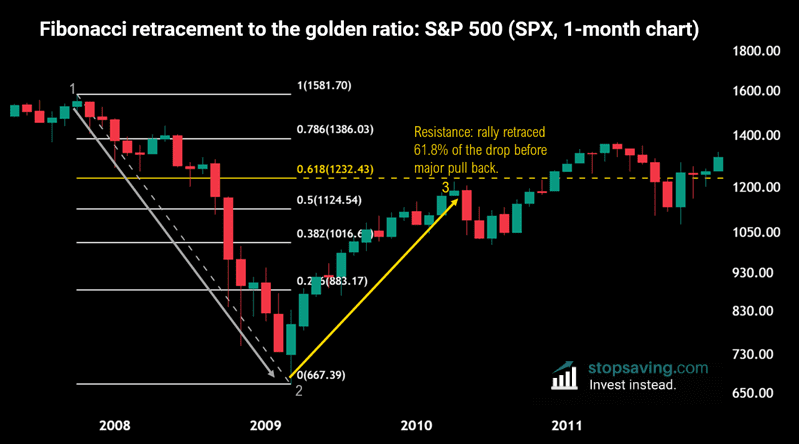
Fibonacci levels are based on the golden ratio (1.618) and are used to find potential retracement levels. It uses horizontal lines to show potential support and resistance levels based on the Fibonacci sequence.
Key Levels:
- 23.6%
- 38.2%
- 50%
- 61.8%
- 78.6%
How to Use:
- Draw from swing low to swing high (or vice versa)
- Look for price to bounce at 38.2%, 50%, or 61.8% levels
These levels often act as support during pullbacks in an uptrend or resistance during rallies in a downtrend.
Why It’s Useful:
- Helps predict where price might reverse
- Useful for setting targets and stop-losses
Example:
If a coin is retracing to the 61.8% level, it might bounce and continue upward.
7. Stochastic Oscillator
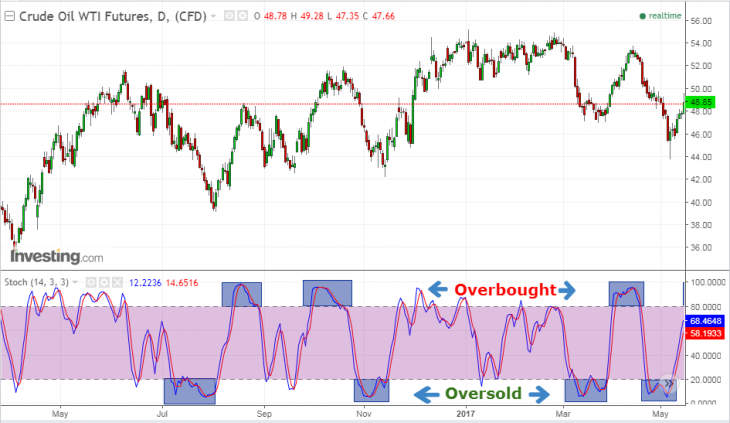
The Stochastic Oscillator is great for identifying short-term reversals. This indicator compares a coin’s closing price to its price range over a certain period.
How It Works:
- Measures closing price relative to price range over a period
- Values range from 0 to 100
Signal Zones:
- Above 80 = Overbought
- Below 20 = Oversold
Crossovers:
- %K line crossing above %D line = Buy signal
- %K line crossing below %D line = Sell signal
Why It’s Useful:
- Identifies overbought or oversold conditions
- Works well in sideways markets
Example:
If the oscillator is below 20, the coin might be oversold.
How to Combine Indicators for Better Results
Using one indicator alone can give false signals. That’s why smart traders combine multiple tools to confirm their decisions.
Popular Combinations:
- RSI + MACD: Confirm momentum and trend
- Moving Averages + Bollinger Bands: Spot breakouts
- Volume + Fibonacci: Confirm support/resistance levels
Tips:
- Don’t overload your chart with too many indicators
- Test combinations on past data (backtesting)
- Stick to what you understand
Tools to Use These Indicators
You don’t need to be a tech wizard to use indicators. Many platforms offer easy-to-use charts with built-in tools.
Popular Platforms:
- TradingView
- Binance
- CoinMarketCap
- CryptoCompare
- Fat Pig Signals — We watch the crypto markets closely, doing in-depth crypto research and using technical & fundamental analysis to find the best opportunities for our clients.
These platforms let you apply indicators with just a few clicks.
Best Practices for Using Crypto Indicators
- Learn how each indicator works before using it
- Combine 2–3 indicators for confirmation
- Practice on demo accounts
- Keep emotions out of your decisions
- Always manage your risk
Frequently Asked Questions (FAQ)
1. What is the best indicator for beginners?
Moving Averages and RSI are great starting points. They are simple, visual, and easy to understand. Learn more about Moving Averages and RSI.
2. Can I use indicators on mobile apps?
Yes! Platforms like TradingView and Binance offer mobile apps with full charting tools.
3. How many indicators should I use?
Stick to 2–3 indicators that complement each other. Too many can cause confusion and mixed signals. Try combining MACD with RSI or Volume.
4. Do indicators work all the time?
No indicator is perfect. They work best when combined with market knowledge, news, and a solid trading plan. Always use risk management.
5. Are these indicators only for crypto?
No. These indicators are used in all markets — stocks, forex, commodities, and more. But they work especially well in the volatile world of cryptocurrency.
6. Can I use these indicators for day trading?
Yes, especially tools like RSI, MACD, and Bollinger Bands. They work well on lower timeframes like 15-min, 1-hour, and 4-hour charts.
7. What’s the best timeframe to use these indicators?
It depends on your strategy:
- Day traders: 5-min to 1-hour
- Swing traders: 4-hour to daily
- Long-term investors: Daily to weekly
8. How do I avoid false signals?
- Combine multiple indicators
- Confirm with volume
- Avoid trading during low liquidity periods
- Use longer timeframes for confirmation
9. Should I trust indicators during news events?
Be cautious. Indicators often fail during high-impact news events. In such cases, price action and volume are more reliable.
10. Are paid indicators better than free ones?
Not necessarily. Most professional traders use free indicators like RSI, MACD, and Fibonacci. What matters is how you use them, not how fancy they look.
Final Thoughts
Crypto trading doesn’t have to be a guessing game. With the right indicators, you can trade with more clarity and confidence. Start simple, learn how each tool works, and build your strategy step by step.
Remember, indicators are guides — not guarantees. Combine them with smart planning, risk control, and continuous learning, and you’ll be well on your way to becoming a more successful trader.
Related Articles

How to discover the best crypto to watch: useful tips

Crypto Signals & Layer 1 Basics