High-Timeframe vs Low-Timeframe Crypto Signals: What Every Beginner Needs to Know
Signals
Ever opened a chart and seen Bitcoin looking bullish on one screen… and bearish on another? You're not going crazy. You're just looking at two different timeframes.
If you've been following crypto signals — whether from Fat Pig Signals or anywhere else — you've probably noticed that some signals reference a "daily chart" while others mention a "5-minute chart" or a "1-hour chart." And you might be wondering: what's the difference, and which one should I actually pay attention to?
Here's the thing: understanding timeframes is one of the most important skills you can develop as a crypto trader. Get this wrong, and you'll constantly feel confused, chasing trades that don't make sense. Get it right, and everything starts to click.
In this guide, you'll learn:
- What high-timeframe and low-timeframe signals actually mean
- Why the same coin can look bullish AND bearish at the same time
- Which timeframe fits your trading style (and your lifestyle)
- How to combine timeframes so your trades have a real edge
Let's break it down.
What Exactly Is a "Timeframe"?
A timeframe (also called a chart interval) is simply how much time each candlestick on your chart represents. Think of it like choosing how zoomed in or zoomed out you want to be when looking at a map.
On a 1-minute chart, each candle shows one minute of price movement. On a daily chart, each candle shows an entire day. Same coin, same market — but completely different pictures.
Here's a quick comparison:
- Low timeframes (LTF): 1-minute, 5-minute, 15-minute charts — like watching a football game through a close-up camera. You see every tackle and pass in detail, but you might miss the overall score.
- High timeframes (HTF): Daily, weekly, monthly charts — like watching from the top of the stadium. You see the flow of the whole game, but the individual plays are harder to spot.
Neither is "better" than the other. They just show you different things. And smart traders use both.
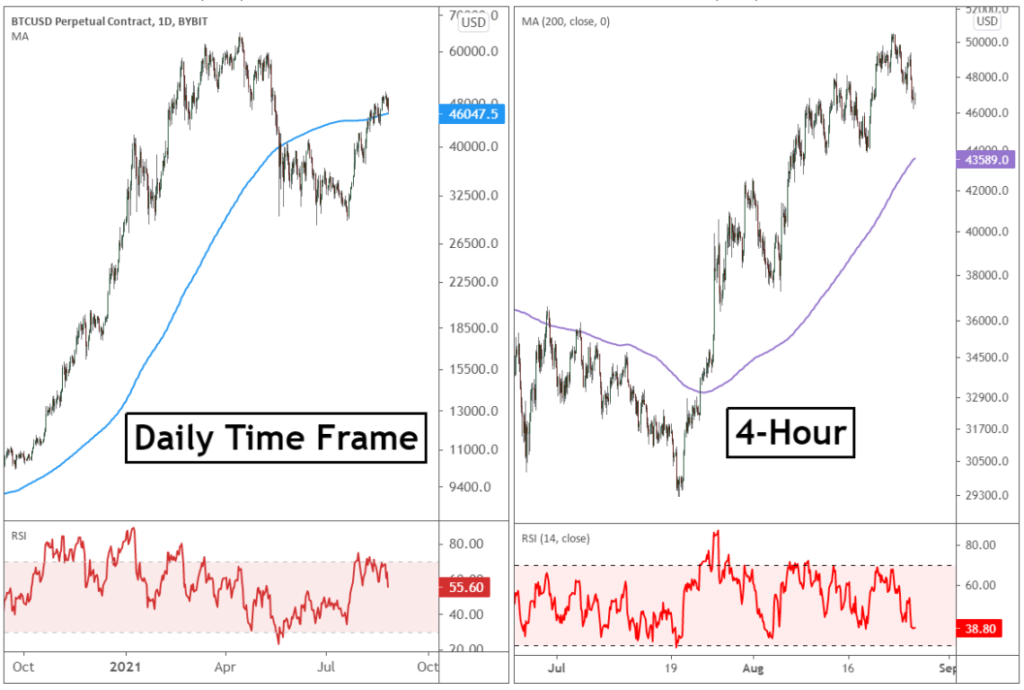
How to Pick the Best Time Frames for Crypto Trading. Image Source: Blueberry Markets
High-Timeframe Signals: The Big Picture View
High-timeframe signals come from charts like the daily, weekly, or monthly. These are the charts that show you the dominant trend — the overall direction the market is heading.
Here's why high-timeframe signals matter:
They filter out the noise. Lower timeframes are full of random price wiggles that look important but actually mean very little. A candle that looks scary on a 5-minute chart might be completely invisible on the daily. High-timeframe charts strip away that noise and show you what's really happening.
They produce stronger signals. A bullish engulfing candle (a pattern where a green candle completely "swallows" the previous red candle, signaling buyers are taking control) on a daily chart carries far more weight than the same pattern on a 5-minute chart. Why? Because it represents an entire day of trading activity, not just five minutes.
They require less screen time. If you're not sitting at your computer all day — and most people aren't — high-timeframe trading fits your life better. You can check charts once or twice a day and still make solid decisions.
💡 Pro Tip: If you're brand new to crypto trading, start with the daily chart. It's the most beginner-friendly timeframe because it gives you cleaner signals, more time to think, and fewer emotional decisions.
Who are high-timeframe signals best for?
- Swing traders who hold positions for several days or weeks
- Position traders who ride longer trends for weeks or months
- Beginners who are still learning to read charts
- Anyone who doesn't want to stare at screens all day
The trade-off? Fewer signals. You might wait days or even weeks for a quality setup. And your stop loss (the price level where you exit to limit your losses) will be wider, meaning you need to be comfortable with bigger price swings before a trade works out.
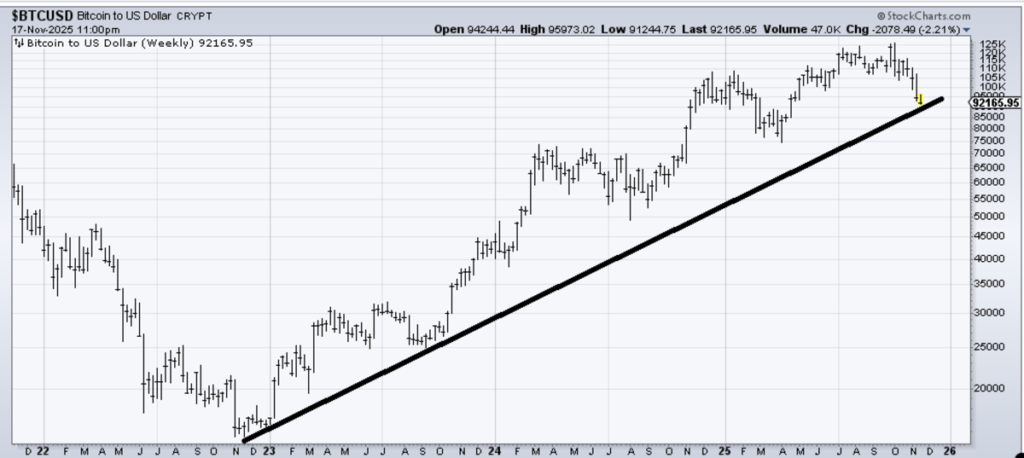
Bitcoin daily chart showing a clear uptrend with clean higher highs and higher lows, with annotations pointing out the trend direction. Image Source: StreetPro
Low-Timeframe Signals: The Close-Up View
Low-timeframe signals come from charts like the 1-minute, 5-minute, or 15-minute. These are the charts that day traders and scalpers use to jump in and out of trades quickly.
Here's what makes low-timeframe signals appealing:
More trading opportunities. Because candles form so quickly, you'll see way more potential setups throughout the day. If you enjoy the action and thrill of active trading, this is where the energy is.
Precise entries and exits. When you know the big-picture trend, low-timeframe charts help you pinpoint exactly where to enter a trade and exactly where to exit. It's like using a magnifying glass to find the best spot.
Smaller risk per trade. Since you're trading smaller price moves, your stop losses tend to be tighter. This means you can risk less per trade — at least in theory.
But here's the catch:
Low-timeframe trading is hard. Much harder than most beginners expect. Here's why:
- More noise, more false signals. That "breakout" on the 5-minute chart? It might just be random volatility that reverses in the next few candles.
- Requires constant attention. You can't set up a trade on a 1-minute chart and walk away to make lunch. These trades demand your full focus.
- Transaction costs add up. Every trade costs you something in spread (the small difference between the buy price and sell price) and slippage (the difference between the price you expected and the price you actually got). Make 20 trades a day, and those small costs become a real problem.
- You're competing with bots. On very short timeframes, you're going head-to-head with high-frequency trading algorithms built by teams of Ph.D. mathematicians. That's a tough game for a beginner.
⚠️ Common Mistake: Many new traders jump straight to 1-minute or 5-minute charts because they think faster trading means faster profits. In reality, it usually means faster losses. Start slow, learn the fundamentals on higher timeframes, and only move to lower timeframes once you're consistently reading the market well.
Who are low-timeframe signals best for?
- Experienced day traders who can dedicate hours to watching charts
- Scalpers looking for quick, small profits
- Traders who use low-timeframe charts in combination with higher-timeframe analysis
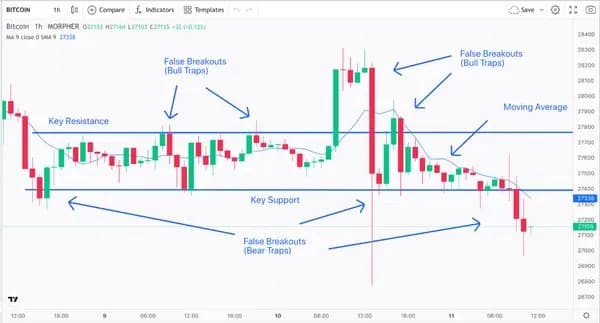
A Bitcoin chart showing choppy price action with multiple false breakouts, with arrows highlighting where a beginner might have been tricked into a bad trade. Image Source: Morpher
Why the Same Coin Can Look Bullish AND Bearish
This is where things get really interesting — and where most beginners get confused.
Let's say you're looking at Bitcoin. On the 15-minute chart, the price just dropped sharply and everything looks bearish. Panic time, right?
But then you switch to the daily chart, and you see that Bitcoin is actually in a strong uptrend, and that "scary drop" on the 15-minute chart is just a tiny pullback — completely normal and healthy.
This happens all the time. The market exists across multiple timeframes simultaneously, and each one can tell a different story.
Here's a real-world analogy: Imagine you're driving on a highway. You hit a pothole and the car bounces — that's the low timeframe. But the highway itself is still heading north — that's the high timeframe. The pothole doesn't change your destination.
This is exactly why experienced traders always check the bigger picture before trading the smaller one. A small dip on the 5-minute chart might actually be a buying opportunity if the daily trend is still strongly bullish.
How to Combine Both Timeframes (The Smart Way)
The most effective approach isn't choosing one timeframe — it's using both together. This is called multi-timeframe analysis, and it's one of the most widely used strategies among successful traders.
Here's how it works in simple terms:
- Start with the higher timeframe. Check the daily or weekly chart to see the overall trend. Is the market going up, down, or sideways? This becomes your directional bias — your sense of which direction you should be trading.
- Move to the lower timeframe. Once you know the trend, switch to a 4-hour, 1-hour, or 15-minute chart to find the right moment to enter a trade in that direction.
- Only take trades that align. If the daily chart says "bullish," you only look for buy signals on the lower timeframe. If the daily says "bearish," you only look for sell signals. This simple filter eliminates a huge number of bad trades.
A practical example:
Let's say Bitcoin's daily chart shows a clear uptrend, and the price just pulled back to a support level (a price zone where buyers tend to step in and push the price back up) around $68,000.
You switch to the 1-hour chart and see the price forming a bullish reversal pattern near that same $68,000 zone. The RSI (Relative Strength Index — a tool that measures whether a coin is overbought or oversold) on the 1-hour chart is bouncing up from oversold territory.
Now you have alignment: the daily trend says "up," the 1-hour chart says "buyers are stepping in right here," and your indicator confirms it. That's a much stronger trade than just blindly buying because the 1-hour chart "looked good."
Our Fat Pig Signals community uses this kind of multi-timeframe thinking when sharing signals — combining the big picture with precise timing so you're not just guessing.
Which Timeframe Is Right for YOU?
There's no single "best" timeframe for everyone. The right choice depends on your lifestyle, your personality, and how much time you can dedicate to trading.
Ask yourself these questions:
- How much time can you spend watching charts each day? If the answer is "not much," stick to daily and 4-hour charts.
- Do you prefer quick decisions or slow, thoughtful analysis? Quick thinkers may enjoy lower timeframes, but patient thinkers often do better on higher ones.
- How do you handle stress? Lower timeframes are intense. If price drops make your heart race, higher timeframes will be kinder to your nerves (and your account).
- What's your goal? If you want to grow your account steadily over months, high-timeframe swing trading is a great path. If you want daily income and can tolerate the grind, day trading might suit you.
Here's a simple guide to match your style:
- Complete beginner: Daily chart only. Learn to read trends, support, and resistance. Don't touch anything below the 4-hour chart yet.
- Swing trader: Use the daily chart for trend direction, the 4-hour chart for entry timing.
- Day trader: Use the 1-hour chart for direction, the 15-minute or 5-minute chart for entries.
- Scalper: Use the 15-minute chart for bias and the 1-minute or 5-minute chart for execution — but only once you're experienced.
Quick Recap
Here's what we covered:
- Timeframes are lenses — they change how you see the same market, not the market itself
- High-timeframe signals are cleaner and more reliable — ideal for beginners and swing traders who want less noise
- Low-timeframe signals offer more action but more risk — suited to experienced day traders with time and discipline
- The same coin can look bullish and bearish simultaneously — depending on which timeframe you're viewing
- Multi-timeframe analysis is the sweet spot — use the higher timeframe for direction, the lower timeframe for timing
- Match your timeframe to your life — not the other way around
The bottom line? Higher timeframes are your foundation. Build there first.
Your Next Steps
Understanding timeframes is a game-changer, and you've just taken a big step forward. Here's how to put this into practice:
1. Today: Open your charting app (TradingView is free and great for beginners) and look at Bitcoin on the daily chart. Identify whether the trend is going up, down, or sideways. Just observe — no trading yet.
2. This week: Practice switching between the daily and 4-hour chart for the same coin. Notice how the 4-hour shows more detail within the daily trend. Start recognizing how the smaller moves fit inside the bigger picture.
3. Ongoing: Join the Fat Pig Signals Telegram community where we share signals with clear timeframe context. You'll see exactly how experienced traders combine high and low timeframes in real-time — and you can ask questions as you learn.
Remember: you don't have to figure this out alone. Every successful trader started right where you are, confused by charts and unsure which timeframe to trust. The difference is they kept learning. And so will you.
Trading is a journey, not a sprint. Take it one chart, one concept, one trade at a time. You're building skills that will serve you for years to come.
[Join our Telegram group here] and start learning alongside traders who've been exactly where you are.
Disclaimer: This article is for educational purposes only and should not be considered financial advice. Cryptocurrency trading involves substantial risk of loss. Always do your own research and consider consulting with a financial advisor before making investment decisions.
Related Articles
How to Stack the Odds in Your Favor Using Technical Confluence

How to Set Stop Losses and Take Profit Targets