Understanding Support and Resistance Levels in Crypto
Signals, Trading
If you’ve ever stared at a Bitcoin chart and wondered, “Why does the price always seem to bounce at certain levels?”. Every beginner eventually hits this moment.
Maybe you watched a coin fall to $30,000, bounce up… then fall again to around the same level and bounce again. Or maybe you saw a coin struggle to climb above $40,000, as if it kept hitting an invisible ceiling.
Those “invisible floors and ceilings” are called support and resistance levels. And once you understand them, trading starts feeling less like guessing — and more like reading a map.
Support and resistance are the foundation of technical analysis, and mastering them can dramatically improve your timing, entries, and exits. In fact, these levels reflect real human psychology — fear, greed, hesitation — built right into the chart.
By the end of this article, you’ll know:
- What support and resistance really mean
- How to spot them on a chart
- How to use them for better buy and sell decisions
- The most common beginner mistakes
- What to do next to level up your trading skills
Let’s get started!
What Exactly Are Support and Resistance?
Before we jump into charts, let’s break it down with a simple analogy.
Imagine a ball bouncing in a room.
- The floor stops the ball from falling → this is support.
- The ceiling stops the ball from rising → this is resistance.
Crypto prices behave the same way.
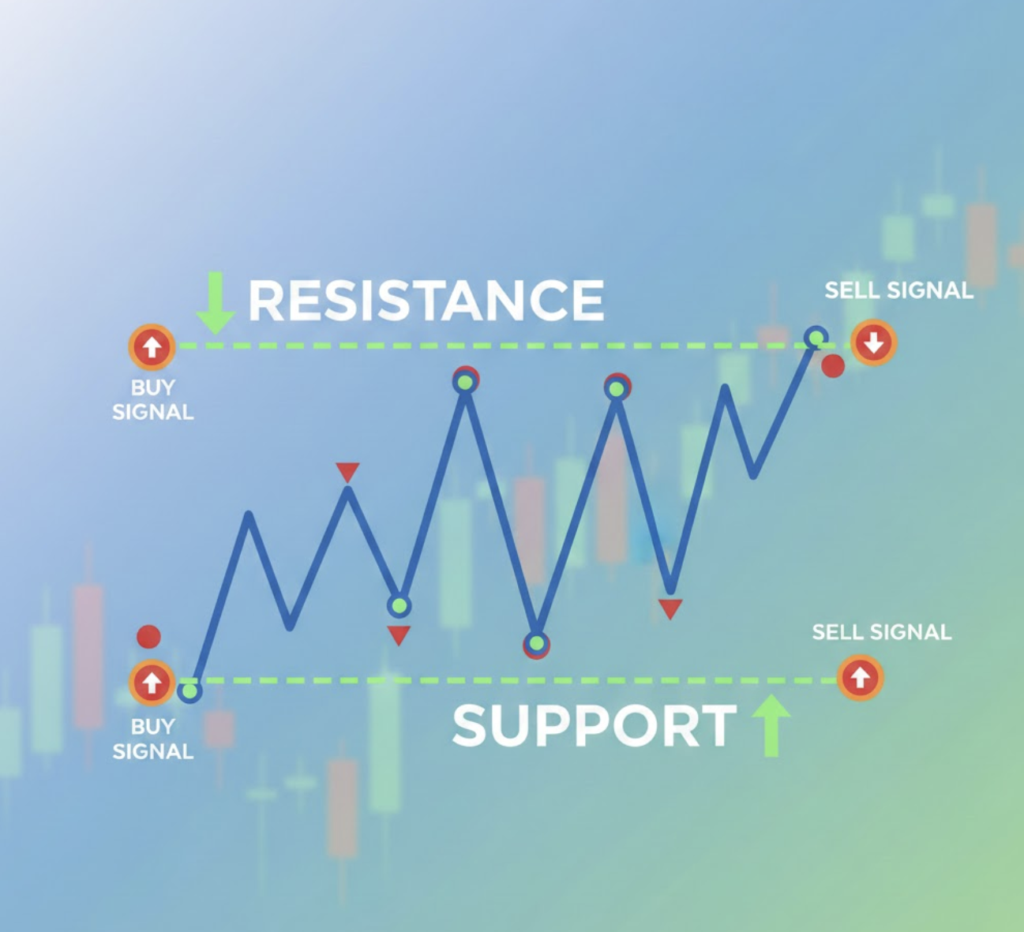
What Is Support?
Support is a price level where a downtrend pauses or bounces upward because lots of people want to buy at that price. Think of it as the “floor” beneath the price.
In simple terms: Support = a price level where buyers show up.
Bitcoin found strong support at $90,000, where buying pressure became strong enough to stop the fall.
Real-world example:
- Bitcoin drops toward $90,000
- Buyers think, “This is cheap. I’m buying!”
- Price bounces up
What Is Resistance?
Resistance is a price level where an uptrend pauses or reverses downward because many traders decide to sell.
In simple terms: Resistance = a price level where sellers show up.
Bitcoin struggled to break above $108,000, creating a clear resistance zone.
Real-world example:
- Bitcoin rises toward $108,000
- Sellers think, “This is high enough — I’m taking profit!”
- Price gets rejected downward
Why These Levels Exist (The Psychology Behind It)
People tend to “anchor” to certain prices based on past experiences. For example:
- “I bought at $30k — if BTC returns to $30k, I’ll buy more.”
- “I sold at $40k — if it gets back there, I’ll sell again.”
This repeated behavior creates support and resistance.
In other words: Support and resistance form because humans are predictable.
How to Identify Support and Resistance Levels
Support and resistance are not magic — they’re patterns you can learn to spot just as reading crypto signals. Here are the simplest ways to identify them.
1. Look for Repeated Bounces (Swing Lows & Highs)
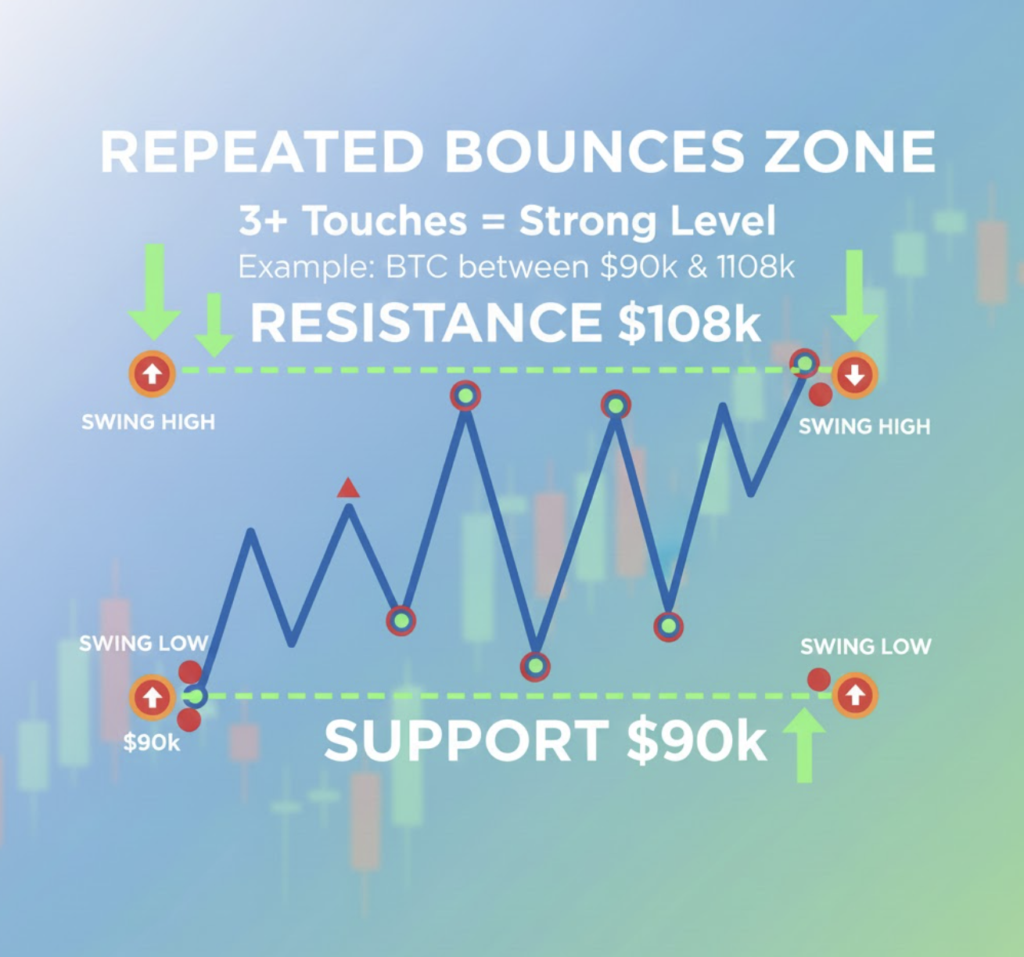
If the price has bounced off the same area three or more times, that level is important. The more times a level holds, the stronger it becomes.
Example:
If BTC repeatedly bounces between $90k (support) and $108k (resistance), you’ve found your zone.
2. Round Numbers Matter More Than You Think
It was emphasized that humans love round numbers like:
- $20,000
- $50,000
- $100,000
Why? Because our brain finds them “neat.” This leads to clusters of buy and sell orders at those levels. So round numbers often act as psychological support and resistance.
3. Moving Averages can Act as Dynamic Support/Resistance
Example : The 200 SMA near $78.5k for Bitcoin acts as additional support. When price approaches the moving average:
- In an uptrend → it may bounce off (support)
- In a downtrend → it may reject (resistance)
4. Trendlines (Diagonal Support & Resistance)
If price forms higher lows or lower highs, draw lines connecting those points.
- Upward trendline → support
- Downward trendline → resistance
It was noted that trendlines need 3 or more touches to be reliable.
5. Candlestick Wicks Show “Tests”
Charts often appear to break support or resistance, but they snap back. These are called “tests,” especially visible when candlestick wicks poke through a level.
This is why traders treat levels as zones, not exact numbers.
How to Use Support & Resistance in Your Trading
Now that you can spot the levels, here’s how to actually use them.
Strategy #1: Trading the Bounce
This is the simplest strategy for beginners.
Buy near support
Because price is more likely to bounce upward.
Sell near resistance
Because the price is more likely to get rejected downward.
Example: BTC fluctuates between $90k support and $108k resistance. Traders might:
- Enter near $90k
- Take profit near $108k
This exact behavior is described : lighten your position near resistance, add near support.
Strategy #2: Trading the Breakout
A breakout occurs when price moves through support or resistance.
If price breaks above resistance → Buy
Because buyers are now in control.
If price breaks below support → Sell
Because sellers have taken control.
BUT WAIT! Breakouts are famous for producing fakeouts — a price briefly breaks the level then reverses.
Some warn traders about false breakouts and emphasize treating levels as zones rather than exact points.
Strategy #3: Trade the Retest After a Breakout
This is one of the safest approaches. When resistance breaks, it often becomes new support.
This is called the principle of polarity.
Example:
- ICP repeatedly rejected at $6.00.
- Once it finally breaks $6.00, traders expect it to move to $7.00.
- If the price falls back to $6.00 and bounces → that’s your entry.
Strategy #4: Setting Stop-Loss and Take-Profit Levels
Support and resistance provide natural locations for risk management.
Place stop-losses:
- Below support when buying
- Above resistance when shorting
It was emphasized that these levels allow traders to set disciplined risk-reward plans.
Strategy #5: Combine With Indicators for Confirmation
Beginners shouldn’t rely solely on support and resistance. Combine them with:
- RSI
- MACD
- Volume spikes
- Moving averages
This is emphasized: support/resistance is powerful, but even better when paired with momentum indicators.
Common Mistake Box
Mistake: Treating support & resistance as exact numbers. These are zones, not thin, perfect lines. Wicks will poke through. Levels will get temporarily “broken.”
Fix: Think in ranges, not precise points.
Pro Tip Box
The more times a level is tested without breaking, the stronger it becomes. This is one of the most important insights.
Real-World Examples
Let’s walk through two simple examples you can use right away.
Example 1: Bitcoin Consolidation Channel
- Support at $90k
- Resistance at $108k
- Market is moving sideways (range)
How a beginner trades it:
- Enter near $90k
- Set stop-loss at $88k
- Sell near $108k
- Repeat while the range holds
This is called range trading.
Example 2: ICP Support & Resistance
- Resistance: $6.00
- Support: $4.50–$5.00
- Next target after breakout: $7.00
How to trade it:
- Buy near $4.50–$5.00
- Take profit near $6.00
- If $6.00 breaks, enter again on retest
- Target $7.00
This shows how support/resistance guides multiple trade setups.
Quick Recap
Here’s what you learned:
- Support = floor where price tends to bounce
- Resistance = ceiling where price tends to fall
- These levels form due to human psychology and repeated behavior
- Round numbers matter
- Use moving averages & trendlines as extra guidance
- Trade the bounce, the breakout, or the retest
- Treat levels as zones, not exact lines
- More touches = stronger level
- Always manage risk with stop-losses
Support and resistance aren’t just lines — they are the “battle zones” between buyers and sellers. As it says: these levels can make or break your trading success.
Conclusion & Next Steps
Support and resistance are simple, powerful, and beginner-friendly. If you only learn one technical skill at the start of your trading journey, let it be this one.
Here’s what to do next:
Support and resistance are simple, powerful, and beginner-friendly. If you only learn one technical skill at the start of your trading journey, let it be this one.
Here’s what to do next:
1. Open a chart and start marking levels.
Look for:
- Repeated highs
- Repeated lows
- Round numbers
- Trendline touches
2. Practice identifying zones, not lines.
3. Join the Fat Pig Signals Telegram community
Our team shares daily market insights, support/resistance charts, and beginner-friendly breakdowns so you can learn faster and trade smarter.
4. Start small — risk management first.
No level is guaranteed to hold. Always protect your capital.
Related Articles

Discovering the best Ethereum Signals: a guide

Swing Trading Crypto: What it is and How to Apply it