How to Identify Bullish and Bearish Market Trends

Cryptocurrencies, Trading
Ever watched Bitcoin's price shoot up and wondered, "How did everyone else know it was about to pump?" Or maybe you've held a coin while it slowly bled down, kicking yourself for not seeing the signs earlier?
Here's the truth: The market leaves clues. Every single time.
Whether prices are heading up (bullish) or down (bearish), there are patterns and signals that experienced traders spot before the big moves happen. And the best part? These aren't secret tricks that only pros know. You can learn to see them too.
In this article, you'll learn exactly how to tell if the market is bullish or bearish, what signs to look for, and how to use this knowledge to make smarter trading decisions.
What Do "Bullish" and "Bearish" Actually Mean?
Bullish means prices are going up (or expected to go up). Think of a bull charging forward with its horns pointing up—that's the direction of the price. When traders say "I'm bullish on Bitcoin," they believe Bitcoin's price will rise.
Bearish means prices are going down (or expected to go down). Imagine a bear swiping down with its paw—that's the price dropping. When someone says "The market looks bearish," they think prices will fall.
Why does this matter? Because the trend is your friend in trading.
If you buy during a bearish trend, you're fighting against the market's direction—like swimming against a strong current. But if you buy during a bullish trend, the market momentum works in your favor.
The Simple Way to Spot a Trend: The Eye Test
Just look at the chart. I know that sounds too simple, but hear me out.
Pull up a Bitcoin or Ethereum chart. Look at the past few weeks or months. Ask yourself: Is the price generally moving up, down, or sideways?
For a bullish trend, you'll see:
- Higher peaks (each top is higher than the last)
- Higher valleys (each dip doesn't go as low as before)
- An overall upward slope
For a bearish trend, you'll see:
- Lower peaks (each rally doesn't reach the previous high)
- Lower valleys (each drop goes lower than before)
- An overall downward slope
Think of it like walking up or down a staircase. In a bullish trend, you're climbing stairs—each step up. In a bearish trend, you're walking downstairs, each step down.
Pro Tip: Start with a longer timeframe like the 1-day or 4-hour chart. Short timeframes (like 5-minute charts) can be noisy and misleading. The bigger picture gives you the real trend.
Let's say Bitcoin is at $45,000. You look at the chart and see that a month ago it was $38,000, two weeks ago it bounced to $42,000, last week it dipped to $40,000, and today it's at $45,000.
Those higher lows and higher highs? That's a bullish trend.
But sometimes the market goes sideways. Prices bounce between roughly the same high and low levels for weeks. That's called consolidation or a sideways market—neither clearly bullish nor bearish. In those cases, it's often smarter to wait for a clear trend to emerge before making big moves.
Using Moving Averages to Confirm the Trend
The eye test works, but sometimes you want more confirmation. That's where moving averages come in.
A moving average is a line on your chart that shows the average price over a certain period (like the last 50 days or 200 days). It smooths out the daily price jumps and shows you the overall direction.
Here's how to use them:
The 50-day and 200-day moving averages are the most popular. You'll find them on almost every trading platform—they're usually labeled as "MA50" and "MA200" or "SMA50" and "SMA200."
Bullish signal: When the price is above the moving average, especially the 200-day, it suggests a bullish trend. Even better? When the 50-day moving average crosses above the 200-day moving average, that's called a "golden cross"—a strong bullish signal.
Bearish signal: When the price falls below the moving average, especially the 200-day, it suggests a bearish trend. When the 50-day crosses below the 200-day, that's a "death cross"—a bearish signal.
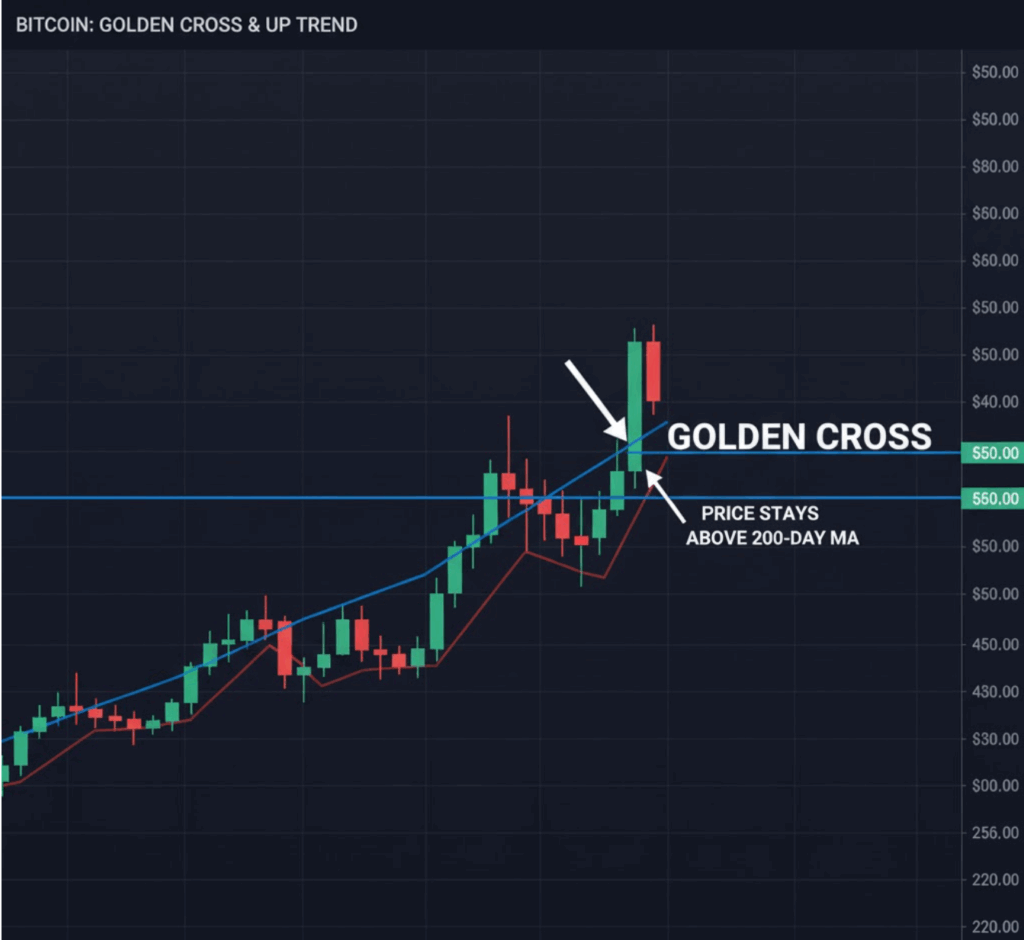
Let's use a real example. Say Bitcoin is trading at $62,000 and its 200-day moving average is at $55,000. The price has been above this line for three months. That's a bullish trend—buyers are in control.
But if Bitcoin drops to $48,000 and the 200-day moving average is at $55,000, with the price struggling below it for weeks? That's bearish. Sellers have momentum.
Common Mistake: Don't rely on moving averages alone. They're lagging indicators, meaning they tell you what has already happened. Use them to confirm what you're seeing with the eye test, not as your only signal.
Volume: The Secret Ingredient
Here's something many beginners miss: volume matters just as much as price direction.
Volume is the amount of crypto being bought and sold. High volume means lots of activity—many traders are jumping in. Low volume means fewer people are trading.
Why does this matter for identifying trends?
In a bullish trend: You want to see increasing volume as prices rise. This confirms that the upward move has strong support. Lots of buyers are jumping in, pushing prices higher.
In a bearish trend: You want to see increasing volume as prices fall. This confirms that sellers are actively pushing prices down with force.
Think of volume like a crowd at a concert. If only a few people are cheering, the energy is weak. But if the whole stadium is roaring, the energy is real and powerful. Same with trends.
Here's a practical example:
Bitcoin climbs from $40,000 to $45,000 over two weeks. You check the volume bars at the bottom of your chart. If volume is increasing as the price rises, that bullish trend has strength—lots of buyers agree. But if the price climbs while volume drops, that's a warning sign. The trend might be running out of steam because fewer people are participating.
Pro Tip: Most exchanges and charting platforms show volume as vertical bars below the main price chart. Green bars typically mean more buying than selling that day, and red bars mean more selling than buying.
Your quick volume checklist:
- Rising prices + rising volume = strong bullish trend
- Falling prices + rising volume = strong bearish trend
- Rising prices + falling volume = weak trend, be cautious
- Falling prices + falling volume = weak trend, might reverse soon
Market Sentiment: What Are Other Traders Thinking?
Trends aren't just about charts and numbers. They're about people—thousands of traders making decisions based on emotion, news, and expectations.
Market sentiment is the overall mood of traders. Are people feeling optimistic (bullish) or fearful (bearish)?
Here's how to gauge sentiment:
Social media and news: Check crypto Twitter, Reddit's r/cryptocurrency, or crypto news sites like CoinDesk. Are people excited and posting rocket emojis? That's bullish sentiment. Are they panicking and talking about crashes? That's a bearish sentiment.
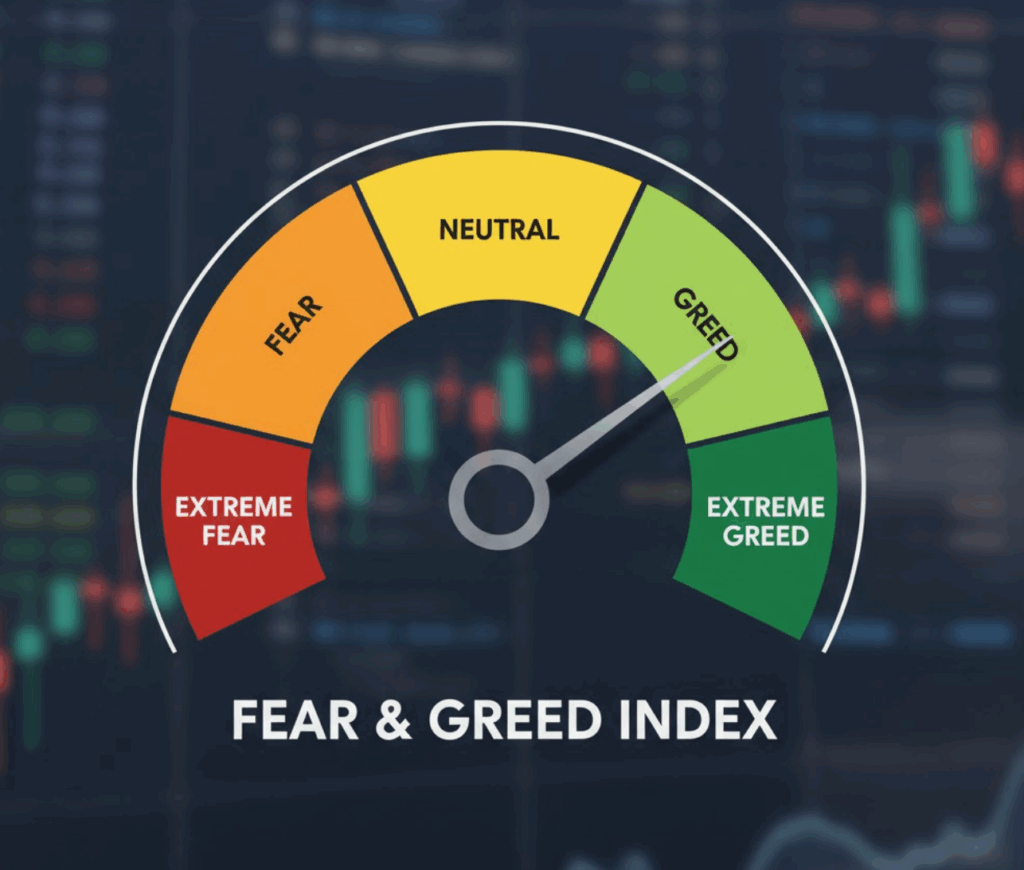
Fear and Greed Index: There's an actual tool called the Crypto Fear and Greed Index that measures market sentiment on a scale from 0 (extreme fear) to 100 (extreme greed). When the index shows extreme fear (below 25), the market is often bearish. When it shows extreme greed (above 75), the market is often bullish—but be careful, that can also mean a top is near.
Exchange funding rates: This is a bit more advanced, but worth knowing. On platforms that offer futures trading, there's a "funding rate" that shows if traders are betting on prices going up (long positions) or down (short positions). Positive funding rates mean most traders are bullish. Negative rates mean they're bearish.
Let's put this together:
You're looking at Ethereum. The price chart shows higher highs and higher lows (bullish structure). Volume is increasing as price rises (strong confirmation). You check Twitter and see excitement about an upcoming Ethereum upgrade. The Fear and Greed Index is at 68 (greedy territory).
All these signals point to a bullish trend. The market structure, volume, and sentiment align. That's when you have the most confidence.
How to Recognize Trend Reversals
What if you can spot when a bullish trend is about to turn bearish—or vice versa?
Trend reversals happen when the market shifts direction. Catching these early can save you from losses or help you catch the next big move.
Here are the warning signs:
Divergence: This is when the price makes a new high, but an indicator like the RSI (Relative Strength Index—a tool that measures if a coin is overbought or oversold) makes a lower high. It's like the price is celebrating, but the energy behind it is weakening. That's a bearish reversal signal.
Example: Bitcoin hits $50,000 (new high), but RSI peaks at 75 instead of the 85 it hit at the last high. The momentum is fading—a reversal might be coming.
Breaking the moving average: If Bitcoin has been riding above its 200-day moving average for months (bullish), and suddenly drops below it with strong volume, that's a potential reversal. The bulls are losing control.
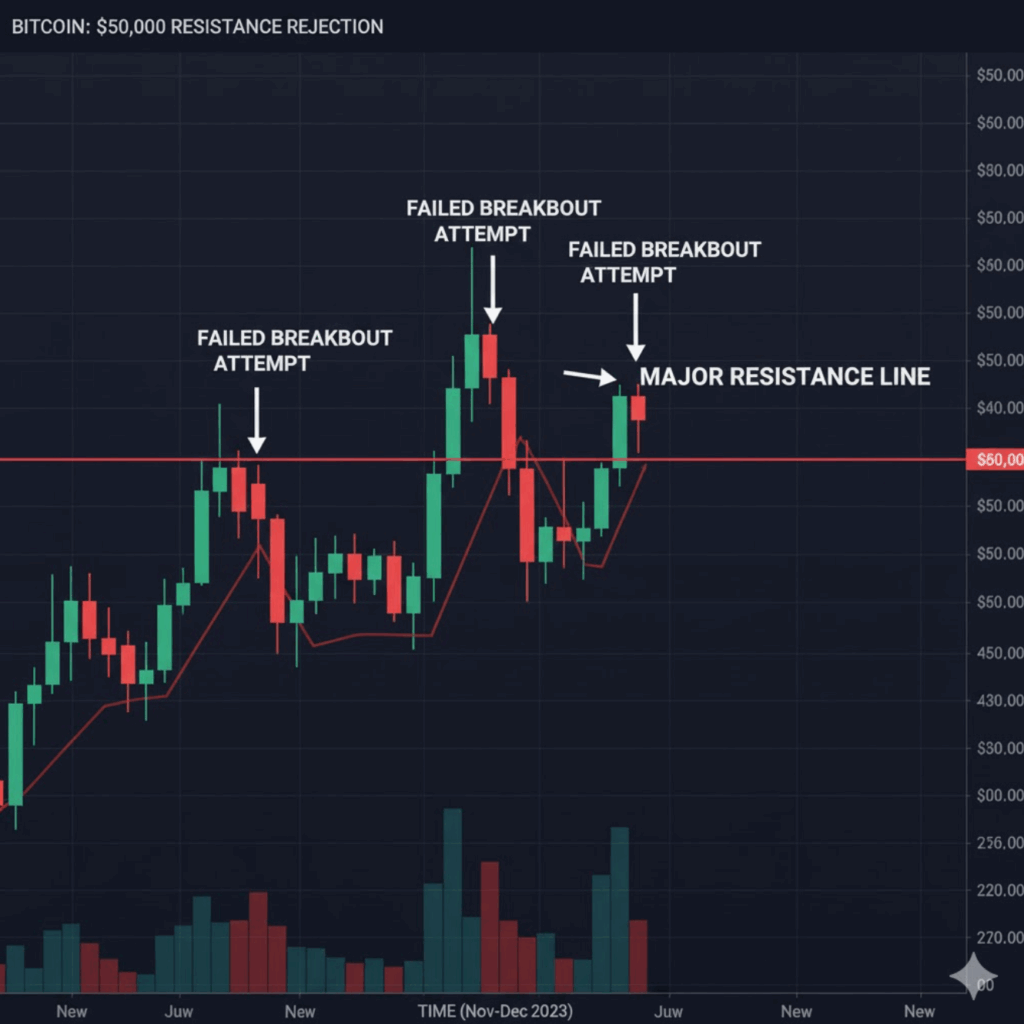
Failed breakouts: The price tries to break above a resistance level (a price point where selling pressure has stopped rallies before) but fails and drops back down. That failed attempt often signals the bullish trend is weakening.
Common Mistake: Don't confuse short-term pullbacks with full reversals. In a bullish trend, prices often dip temporarily (called a "correction" or "healthy pullback") before continuing up. In a pullback, the price stays above major support levels and moving averages. In a reversal, it breaks below them with conviction.
Your Trend Identification Checklist
Okay, let's bring everything we've covered into a simple process you can follow every time you look at a chart.
Step 1: Check the overall price structure
- Are you seeing higher highs and higher lows (bullish) or lower highs and lower lows (bearish)?
- Zoom out to the 1-day chart for the big picture
Step 2: Add moving averages
- Is the price above the 50-day and 200-day moving averages (bullish) or below them (bearish)?
- Did the 50-day recently cross above or below the 200-day?
Step 3: Analyze volume
- Is volume increasing along with the price move?
- Strong trends have rising volume; weak trends have falling volume
Step 4: Check market sentiment
- What's the mood on social media and news?
- Where is the Fear and Greed Index pointing?
Step 5: Look for reversal signals
- Are there divergences, failed breakouts, or key moving average breaks?
- Is the trend losing momentum?
If most of these signals align, you've identified the trend. If they're mixed, the market might be in transition, wait for clarity before making big moves.
Conclusion & Next Steps
Identifying bullish and bearish trends isn't about predicting the future. It's about reading the present clearly. The market tells you what it's doing right now through price structure, volume, and sentiment. Your job is to listen to what it's saying and make decisions based on evidence, not emotion.
The difference between them and beginners? They kept practicing.
Your Next Steps:
- Today: Open your exchange or charting platform (TradingView is free and great for beginners). Pull up Bitcoin or Ethereum on the 1-day chart. Practice identifying whether the trend is bullish, bearish, or sideways using the eye test and moving averages.
- This Week: Each morning, check one coin and ask yourself: "What's the trend right now?" Look at price structure, add the 50-day and 200-day moving averages, and check volume. Do this for 7 days straight. You'll be amazed how much clearer trends become with practice.
- Ongoing: Join the Fat Pig Signals Telegram community where we share trend analysis, discuss what we're seeing in the market, and help each other read the signals more accurately. You don't have to figure this out alone.
Disclaimer: This article is for educational purposes only and should not be considered financial advice. Cryptocurrency trading involves substantial risk of loss. Always do your own research and consider consulting with a financial advisor before making investment decisions.
Related Articles

Fundamental Analysis vs Technical Analysis in Crypto

Receiving Crypto as a Gift: Here’s What You Can Do