How To Swing Trade Crypto Like a Pro

Trading
Swing trading in the crypto market can be exciting and profitable. Unlike day trading, which requires constant attention, swing trading allows you to hold positions for days or weeks. This strategy helps you take advantage of price fluctuations without the stress of minute-to-minute trading.
In this article, we’ll explore essential tips and techniques to help you swing trade crypto like a pro perfect for beginners or those who have some experience. Let’s dive in!
The Swing Trading Advantage
Swing trading is not about getting lucky on wild price movements but in positioning yourself strategically in the sweet spot between day trading and the patience required for long-term holding.
What Makes Crypto Perfect for Swing Trading
Unlike traditional markets that close for weekends and holidays, cryptocurrency operates 24/7, creating endless opportunities for price swings. When Ethereum jumped from €1,200 to €4,000 in 2021, swing traders who understood market cycles captured massive gains that HODLers had to wait years to see.
The volatility that scares many investors is exactly what makes swing trading so powerful. Bitcoin's tendency to oscillate between support and resistance levels over several days to weeks creates predictable patterns that swing traders can exploit.
While day traders get caught in market noise and long-term investors sit through painful drawdowns, swing traders capture the meat of every major move.
Why Swing Trading Beats Other Strategies
Time Freedom Without Sacrifice
Day trading demands you stare at charts for 8-12 hours daily. HODLing requires years of patience through brutal bear markets. Swing trading gives you the best of both worlds – significant profit potential without becoming a slave to your screen.
Lower Risk, Higher Rewards
Unlike day trading which involves rapid decision-making and higher risk due to market volatility, swing trading offers better risk management through longer holding periods. You have time to analyze your positions, adjust your strategy, and avoid the emotional mistakes that destroy day traders.
Perfect for Crypto's Natural Cycles
Markets move in cycles, oscillating up and down depending on various factors. Swing trading is designed specifically to profit from these oscillations or "swings" in price. Crypto's extreme volatility makes these cycles more profitable than in traditional markets.
Real Profit Examples That Changed Everything
Looking at documented swing trading results, AAVE delivered 3200% gains, AXS hit 4200%, CAKE exploded for 8700%, BNB returned 2000%, ETH provided 400%, and MANA delivered 600%.
These aren't theoretical numbers, they're real trades that real traders captured by understanding swing trading principles.
Example:
If you had implemented a perfect swing trading strategy on Bitcoin between February and June 2024, three strategic trades could have turned $5,000 into $13,755 – a 175% return in just three months, compared to just 65% from simply holding.
Why Most Traders Get This Wrong
The biggest mistake traders make is trying to catch every single move. They see Bitcoin drop 5% and panic sell, or they see it pump 3% and FOMO buy. Swing trading teaches you to zoom out, identify the bigger picture, and position yourself for substantial moves rather than market noise.
The strategy focuses on capturing short to medium-term price fluctuations, typically holding positions for several days to weeks, allowing traders to benefit from larger price movements without constant monitoring.
The opportunity in crypto swing trading has never been greater. With institutional adoption increasing volatility patterns and retail traders still making the same emotional mistakes, skilled swing traders have a significant edge that will only grow with time.
Tools Every Swing Trader Must Master
Your technical analysis needs to be adapted specifically for crypto's unique behavior. Here are helpful tools to consider:
Support and Resistance
Support is where buying pressure typically emerges, preventing prices from falling further. Resistance is where selling pressure kicks in, stopping upward momentum.
An Illustration of Swing Trading: Support and Resistance. Image Source: Trading Setup Review

In crypto swing trading, these levels are absolutely critical because they help you identify where other traders are likely to make decisions. Bitcoin might consistently bounce off $40,000 (support) and struggle to break $50,000 (resistance). These aren't random numbers - they represent psychological price points where millions of dollars in orders cluster.
Here's how to identify these levels:
Look for areas where price has reversed direction at least twice. The more times a level holds, the stronger it becomes. When Bitcoin tested $30,000 three times during the 2022 bear market and bounced each time, that became a major support level that swing traders could rely on.
The beauty of support and resistance is that once broken, a support can turn into resistance and vice-versa. This flip is one of the most reliable phenomena in crypto markets.
Moving Averages
Moving averages smooth out price action and help you see the bigger picture. For swing trading, I focus on three key timeframes: the 20-day, 50-day, and 200-day moving averages.
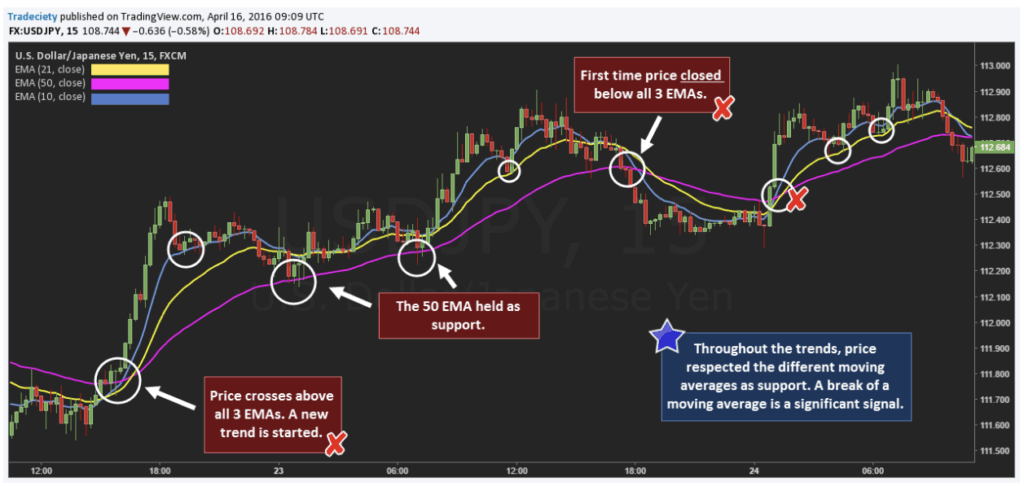
An Illustration of Swing Trading: Moving Averages. Image Source: Tradeciety
The 200-day moving average is particularly powerful - if the price is above it, you can consider the asset to be in an uptrend, and vice-versa. The real magic happens when moving averages cross.
When the short-term moving average crosses above the long-term moving average, it generates a bullish signal called a "Golden Cross." But when it crosses below, it creates a "Death Cross" suggesting bearish momentum.
During Bitcoin's 2023 recovery, the Golden Cross in February provided an excellent swing trading entry signal. Those who caught this move rode Bitcoin from $25,000 to over $40,000 in just a few months.
RSI and MACD
The Relative Strength Index (RSI) and Moving Average Convergence Divergence (MACD) are momentum indicators that help you time entries and exits with precision.
An Illustration of Swing Trading: RSI and MACD. Image Source: QuantifiedStrategies

RSI measures momentum on a scale from 0 to 100. Traditionally, levels above 70 indicate an asset is overbought and may be primed for a sell-off, while levels below 30 suggest it's oversold and might be ripe for a buy. In strong trending markets, these thresholds shift to 80 and 20 respectively.
The MACD tells a different story. When the MACD line crosses above the signal line, it can signal a bullish move, while a crossover below can indicate a bearish trend. The histogram shows you the strength of momentum - growing positive bars suggest building bullish pressure. The key is combining these signals with your support/resistance analysis.
Volume
In swing trading, volume acts as a verifier of price action. High trading volumes during a price rise indicate strong buying interest, affirming the bullish trend. Volume is like a lie detector for price movements.
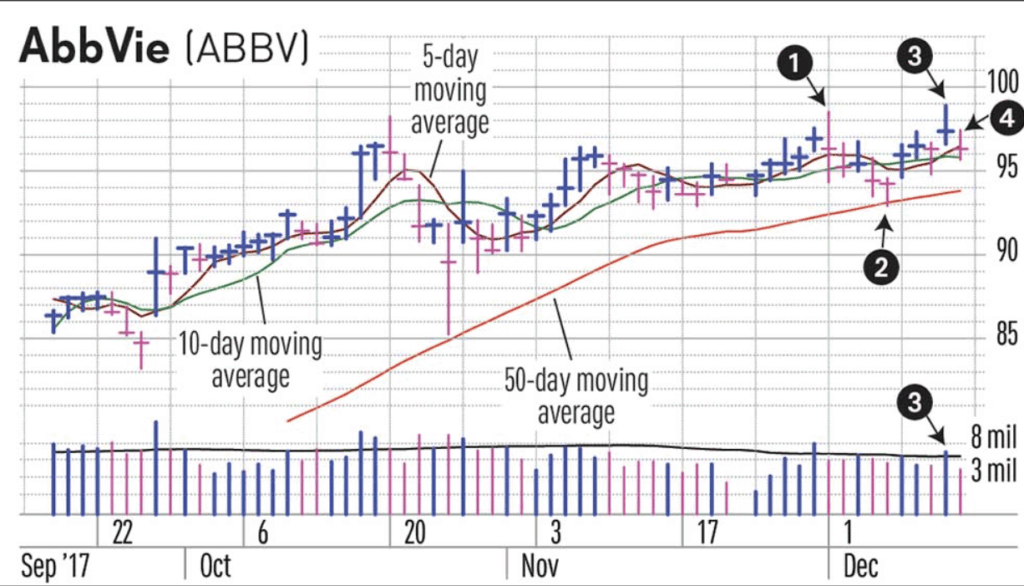
An Illustration of Swing Trading: Volume. Image Source: Investors
When Bitcoin breaks above resistance on massive volume, that breakout is likely genuine. But if it breaks on weak volume, be skeptical - it might be a false breakout that quickly reverses.
Here's a professional trick: when prices rise without significant volume, the upward trend lacks strength. Similarly, falling prices with low volume might not signal a true downturn. Always align price movements with corresponding volume spikes to separate real moves from market noise.
Your Action Step
Choose one major cryptocurrency and spend the next week studying its chart. Identify 3 support levels, 3 resistance levels, and note how it reacts to the 200-day moving average. Mark these levels and watch how price behaves when it approaches them. This simple exercise will teach you more about market behavior than reading 100 trading books.
The crypto market rewards those who master the basics and apply them consistently. Technical analysis provides the framework, but your discipline and patience determine your success.
The 4-Step Opportunity Identification Process

Step 1: Market Structure Analysis
Before you even look at individual coins, you need to understand the broader market context. Is Bitcoin trending up, down, or sideways? What's the overall sentiment in crypto?
Use the 200-day moving average as your north star. When Bitcoin is above this level, you're generally in a bull market environment where swing trades on the long side have higher probability. Below it, and you want to be more cautious or look for short opportunities.
Step 2: Asset Selection Criteria
Not all cryptocurrencies are suitable for swing trading. You want assets with:
- Market cap above $100 million (for sufficient liquidity)
- Daily trading volume of at least $10 million
- Clear support and resistance levels on the charts
- Recent price volatility between 5-15% daily moves
Bitcoin and Ethereum remain the most reliable for swing trading due to their liquidity and predictable price patterns. Established altcoins like Cardano, Polkadot, and Binance Coin also offer good opportunities when the setups align.
Step 3: Technical Setup Confirmation
This is where the rubber meets the road. You need at least three confluences:
- A clear trend or range-bound pattern
- Support/resistance level that's been tested multiple times
- Momentum indicator showing divergence or oversold/overbought conditions
The RSI is particularly useful here. When it drops below 30 in an uptrend, that's often your entry signal. Above 70 in a downtrend suggests a potential short setup.
Step 4: Risk-Reward Assessment
Every swing trade should offer at least a 2:1 risk-reward ratio. If you're risking $100, your target should be $200 minimum. This math ensures that even with a 50% win rate, you'll be profitable over time.
Timing Your Entries and Exits
The difference between a good swing trader and a great one often comes down to execution timing. Here's what I've learned about getting in and out at the right moments:
Entry Strategies:
- Wait for a pullback to support in an uptrend
- Look for breakouts above resistance with volume confirmation
- Use limit orders to get better fills during volatile moves
Exit Planning: Set your profit targets before you enter the trade. Scale out of positions – taking 50% profit at the first resistance level, then letting the remainder run with a trailing stop.
The psychology here is crucial. It's tempting to hold for "maximum gains," but consistent smaller wins beat the occasional home run every time.
How Fat Pig Signals Can Help
At Fat Pig Signals, we've developed a systematic approach that combines these indicators effectively. We don't chase every signal. Instead, we wait for confluence, where multiple indicators align to suggest the same direction.
For example, a perfect swing trade setup might include: price approaching strong support, RSI showing oversold conditions, volume increasing, and the asset trading above its 200-day moving average. When 3-4 indicators agree, the probability of success increases dramatically.
Are you ready to start building something that lasts? Join thousands of successful traders in our Fat Pig Signals community. Get access to daily analysis, early project alerts, and proven strategies that have generated millions in profits for our members.
The Long-Term Outlook
Crypto swing trading will evolve, but the core principles remain constant. Markets will always move in cycles. Human psychology will continue driving these cycles. Technical analysis will remain relevant because it reflects human behavior patterns.
Start small, stay consistent, and focus on the process over profits. The skills you develop now will serve you through multiple market cycles. And remember - the goal is building a sustainable approach that works for your lifestyle and risk tolerance.
Related Articles

Swing Trading Crypto: What it is and How to Apply it

Crypto Signals & Layer 1 Basics