Bollinger Bands: How to Easily Spot Trading Opportunities
News
If you’re into trading, you’ve probably heard of Bollinger Bands. But don’t mistake them as just another set of squiggly lines on your price chart. Bollinger Bands are powerful tools that can unlock deep insights into market volatility, momentum, and potential price moves.
In this article, we’ll dive deep into Bollinger Bands, not just the basics, but the juicy details traders beyond the beginner stage crave. By the end, you’ll see how to use them like a pro to spot trading opportunities in stocks, crypto, and futures markets with confidence.
What Are Bollinger Bands?
Bollinger Bands are a popular technical analysis tool used to understand price volatility and potential trading opportunities. They consist of three lines on a price chart:
- The middle band is your baseline, usually the 20-period SMA.
- The upper band sits two standard deviations above.
- The lower band sits two standard deviations below
These bands are set at two standard deviations away from the SMA, which means about 95% of price action typically stays within these boundaries. That’s the statistical backbone of Bollinger Bands.
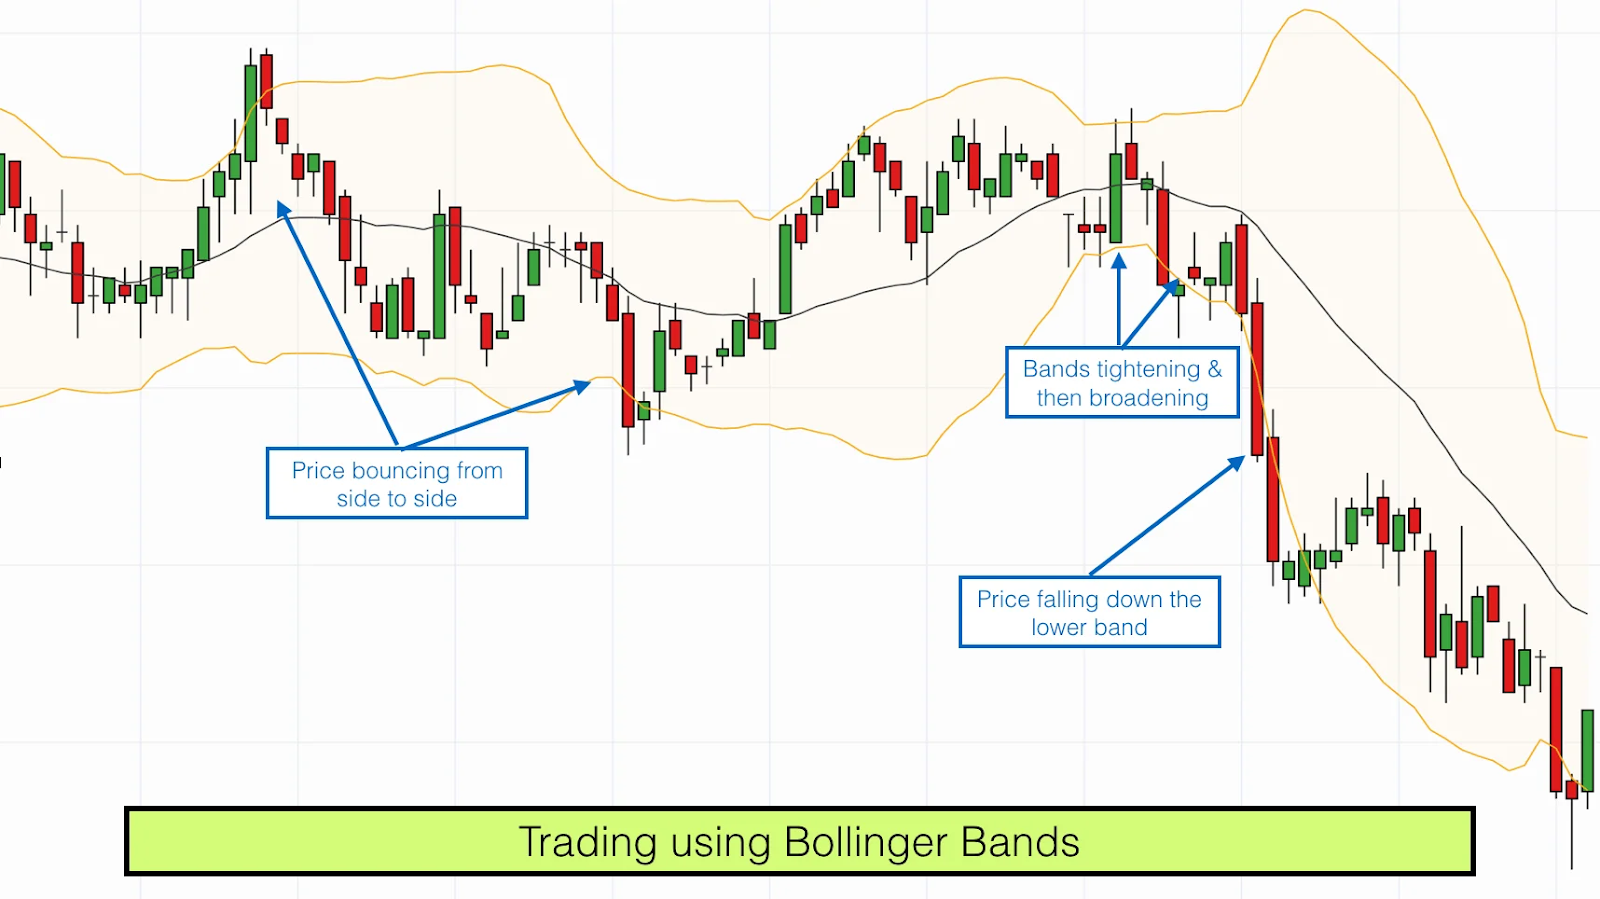
Contrary to common misconceptions, these bands don’t act as static support or resistance levels. They flex, expand, and contract based on market volatility. This dynamism is what makes Bollinger Bands so valuable.
Reading Market Psychology Through Bollinger Bands
Bollinger Bands don’t just chart price—they echo trader sentiment. When price grips the upper band, some might shout, “Overbought!” While touching the lower band might signal “Oversold!” But it’s not always that straightforward.
Sometimes price “hugs” the bands in strong trends, running along the upper band for a bullish march or skating the lower band during bearish momentum. This “band ride” reveals underlying conviction, not necessarily a reversal.
The trick is to read these interactions within context. False breakouts and traps are common when traders blindly assume “touch = reversal.” Instead, use Bollinger Bands as a lens to decode the crowd’s psychology and pair that with other signals.
Advanced Setups with Bollinger Bands
Let’s get into the exciting stuff—the setups that can really move your trades from guesswork to calculated strategy.
1. Bollinger Band Squeeze
Ever noticed how sometimes those bands start pinching tight, wrapping price in a narrow chokehold? That’s the Bollinger Band squeeze, a classic signal of low volatility loading up for a potential explosion. When the bands snap out wide again, price often follows with strong moves.
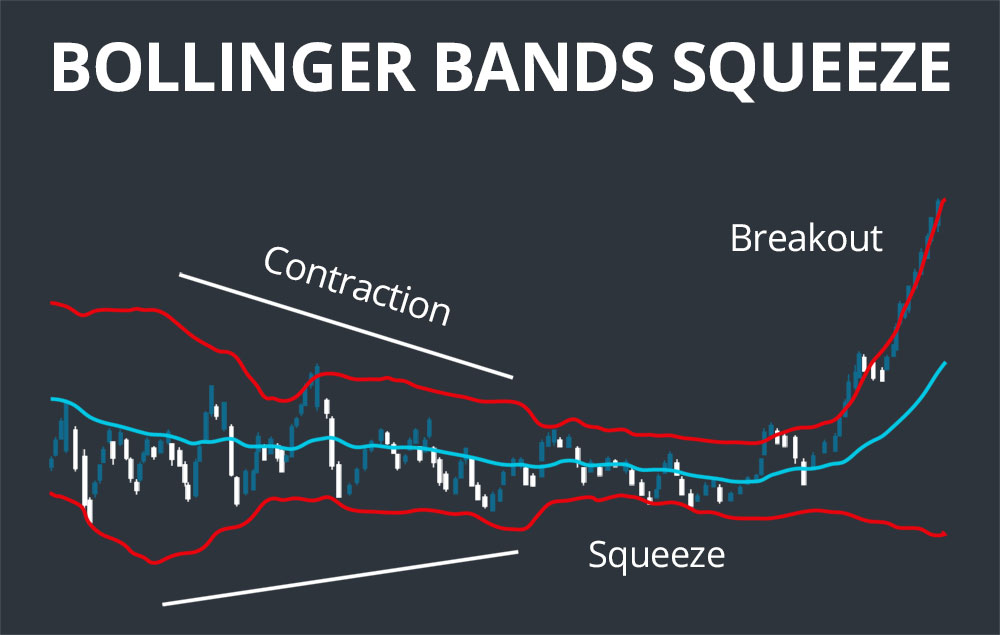
How to spot a squeeze?
- Look for narrow band width compared to recent history.
- Use alerts or indicators measuring band width for confirmation.
- Watch volume—real breakouts usually bring a volume surge.
2. Bollinger Band Walk
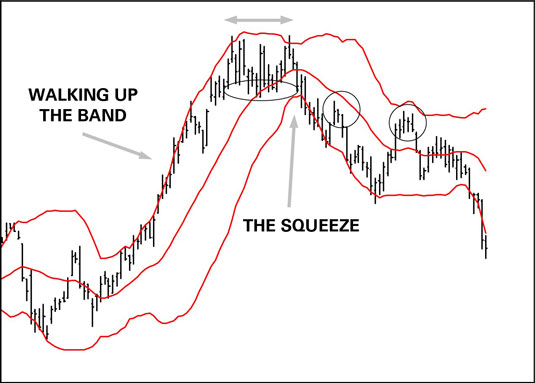
When price isn’t just touching but riding the upper or lower band for an extended time, that’s a Bollinger Band Walk. It signals strong momentum that can be your friend if you know how to ride the wave.
Tips for trading it:
- Use trailing stops just inside the opposite band to protect profits.
- Confirm momentum with indicators like RSI or MACD to avoid burnout.
- Prepare for reversals—band walks don’t last forever.
3. Bollinger Bounce
In range-bound markets, price tends to bounce between the bands, reverting to the mean (middle band). This classic reversal setup works well but demands confirmation.
Watch for:
- Strong candlestick reversal patterns at the band edges.
- Overbought/oversold indicators aligning.
- Volume contraction near bands, signaling loss of momentum.
How to Create Winning Strategies Using Bollinger Bands
Bollinger Bands shine brightest when combined cleverly with other tools. Here’s how to create setups that stack the odds in your favor.
- RSI/Stochastics: Help confirm overbought or oversold levels when price touches upper or lower bands.
- Volume: Validates the strength of breakouts or squeezes.
- Price Action: Candlestick patterns like pin bars or engulfing candles near bands often precede reversals.
Why Bollinger Bands Work Well in Crypto and Futures
Crypto markets are notorious for their wild mood swings and surprises—exactly where Bollinger Bands’ volatility adaptability becomes a superpower.
One size doesn’t fit all here:
- For coins like Solana with rapid swings, tighten your moving average periods to catch quicker shifts.
- For Bitcoin futures, longer periods help smooth out noise.
- Adjust standard deviation multipliers based on how “wide” you want your bands.
Whether you’re scalping 5-minute charts or holding a swing trade for weeks, Bollinger Bands bring clarity in chaos.
Mistakes to Avoid
Even the best tool falters in the wrong hands. Avoid these common mistakes:
- Blind action on band touches: Don’t buy or sell just because price hits a band.
- Ignoring trend and volume: Bands alone can’t confirm direction or strength.
- Misreading squeezes: Narrow bands can sustain for long periods before a breakout.
- Overtrading in choppy markets: Bands can throw false signals when price lacks clear direction.
Conclusion
Bollinger Bands are more than colorful chart lines, they’re a window into market psychology, volatility, and momentum. Used wisely and combined with solid confirmation, they transform chaotic price action into actionable opportunity.
Patience is your secret weapon. Bollinger Band signals often require discipline—wait for confirmations, control FOMO, and don’t chase every breakout. Trust the process, not the hype. Remember, no indicator is a crystal ball. Discipline, risk management, and your own trading experience complete the puzzle.
If you want to save time and gain an edge in crypto markets, Fat Pig Signals is a professional team delivering carefully analyzed Bitcoin and altcoin signals regularly. Their expertise can help you spot and act on opportunities fast, using advanced tools like Bollinger Bands combined with deep market knowledge.
Related Articles

Bitcoin Prices Fall Amidst Tether Investigation Reports: What You Need to Know
How Traders Can Call Options to Increase Their Bitcoin Holdings