How to Track Your Trading Performance
Trading
Do you actually know if you're making or losing money trading crypto? Sure, you remember that amazing 50% gain on Ethereum last month. But what about the three small losses before that? The fees you paid? That disaster with the memecoin your friend recommended?
Most beginners have no idea if they're actually profitable. They remember the wins, forget the losses, and never count the fees. It's like trying to lose weight without ever stepping on a scale—you're just guessing.
Professional traders track everything. Every trade, every fee, every mistake. Not because they love spreadsheets (they don't), but because tracking is the only way to improve. You can't fix what you don't measure.
By the end of this article, you'll know precisely how to track your trades, calculate your real profits (not the fantasy version), and spot the patterns that are costing you money. No more guessing. No more selective memory. Just precise data that shows you exactly where you stand and how to get better.
Why Most Traders Never Improve
The Selective Memory Problem
Your brain is wired to remember victories and forget defeats. It's a survival mechanism that keeps you confident. But in trading, it keeps you broke. Here's what happens without tracking:
You make 10 trades. Three big wins stick in your memory. Seven small losses? Your brain files those under "unimportant" and forgets them. You think you're crushing it. Your exchange balance says otherwise.
It's like a leaky bucket. You keep pouring water in (making trades), celebrating when the level rises, but ignoring all the holes draining your account.
The Hidden Costs You're Missing
Think you made 20% on that Bitcoin trade? Let's check the real math:
What you remember:
- Bought at $40,000
- Sold at $48,000
- Profit: $8,000 (20%)
What actually happened:
- Bought at $40,000 + 0.5% fee = $40,200
- Sold at $48,000 - 0.5% fee = $47,760
- Network fees for transfers: $100
- Actual profit: $7,460 (18.65%)
Now multiply those "missing" percentages across dozens of trades. That's serious money disappearing.
Common Mistake: Calculating profits without including fees is like weighing yourself without your clothes, then putting them on and wondering why you're heavier. The costs are always there—count them.
Why Tracking Equals Improvement
Here's what tracking does that nothing else can:
It reveals patterns. Maybe you always lose money on Sundays. Maybe you're great at Bitcoin but terrible at altcoins. Maybe you hold losers too long and sell winners too early. You'll never know without data.
It kills delusions. That strategy you think is working? The data might show it's actually losing money. That coin you love trading? It might be your biggest money pit.
It builds discipline. When you know you have to record a trade, you think twice. "Do I really want to FOMO into this pump? I'll have to write down another loss if it fails."
Setting Up Your Trading Journal
The Essential Information to Track
You don't need to track everything—just the stuff that matters. Here's your essential checklist for every trade in your trading journal:
The Basics:
- Date and time of entry
- Coin/token traded
- Buy price
- Amount purchased
- Total cost (including fees)
The Exit:
- Date and time of exit
- Sell price
- Amount sold
- Total received (after fees)
The Analysis:
- Profit/loss in dollars
- Profit/loss percentage
- Reason for entering trade
- Reason for exiting trade
That's it. Takes 30 seconds per trade to record. Could save you thousands by revealing what's not working.
Choosing Your Tracking Method
Option 1: Simple Spreadsheet (Free and Easy)
Google Sheets or Excel works perfectly. Create columns for each data point above.
Here's a basic template structure:
Date | Coin | Entry Price | Amount | Fees | Exit Price | Exit Fees | P/L $ | P/L % | Notes
Use Google Sheets so you can update it from your phone right after placing trades. If you wait until later, you'll forget the details or skip it entirely.
Option 2: Trading Journal Apps
Apps like Tradervue, Edgewonk, or CoinTracker automate some tracking. They can import trades directly from major exchanges.
Pros: Automatic calculations, pretty charts, advanced analytics Cons: Usually cost money, might be overkill for beginners
Option 3: Exchange History + Notes
Most exchanges let you export your trade history as a CSV file. Download it weekly and add your notes about why you entered/exited.
Pros: 100% accurate prices and fees Cons: Doesn't capture your reasoning or mistakes
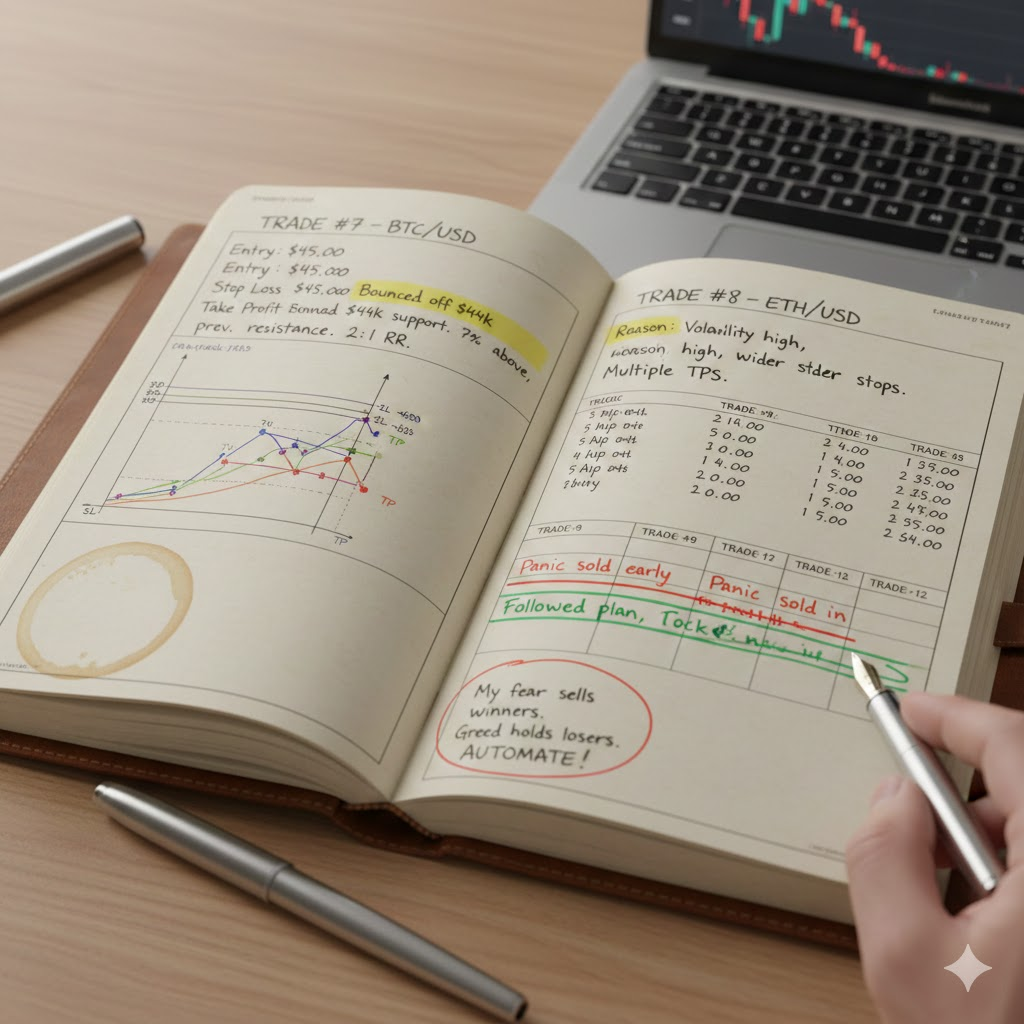
Recording Your Reasoning (The Secret Weapon)
The numbers tell you what happened. Your notes tell you why it happened.
For every trade, write one sentence about:
- Why you entered: "RSI oversold + support level"
- Why you exited: "Hit take profit target" or "Stop loss triggered"
After 20 trades, you'll see patterns:
- "FOMO" entries usually lose
- "Support level" entries usually win
- Exits "because it dropped" lose more than planned exits
This is gold. This is how you actually improve.
Key Metrics That Actually Matter
Win Rate vs. Profitability
Here's something that might blow your mind: Your win rate doesn't matter as much as you think.
Trader A:
- Wins: 70% of trades
- Average win: $100
- Average loss: $400
- Result: LOSES MONEY
Trader B:
- Wins: 30% of trades
- Average win: $500
- Average loss: $100
- Result: MAKES MONEY
See the difference? It's not about being right more often. It's about making more when you're right than you lose when you're wrong.
How to calculate your risk-reward ratio:
Average Win ÷ Average Loss = Risk-Reward Ratio
If this number is above 1.5, you can be profitable even with a 40% win rate.
The Real P&L Calculation
P&L (Profit and Loss—the actual money you made or lost) isn't just sell price minus buy price.
Here's the complete formula:
Real P&L = (Sell Price × Amount Sold - Sell Fees) - (Buy Price × Amount Bought + Buy Fees)
Example with real numbers:
- Bought: 0.5 ETH at $3,000 = $1,500
- Buy fee (0.5%): $7.50
- Total cost: $1,507.50
- Sold: 0.5 ETH at $3,300 = $1,650
- Sell fee (0.5%): $8.25
- Total received: $1,641.75
- Real P&L: $1,641.75 - $1,507.50 = $134.25
Not $150 like you might have thought. Those fees add up.
Tracking Your Hit Rate by Strategy
Not all strategies are equal. Track success rates for each approach you use:
- Breakout trades: 45% success rate
- Support bounces: 62% success rate
- News-based trades: 31% success rate
After 10 trades per strategy, you'll know what works for YOU. Not what some YouTube guru says works. What actually makes YOU money?
Learning From Your Losses
The Post-Trade Analysis
Every loss is tuition in the trading university. But only if you study it.
After each losing trade, ask:
- Was my entry plan wrong?
- Did I follow my plan?
- Was it bad luck or bad decision?
Example analysis: "Bought SHIB because Twitter was pumping it. No technical reason. Sold at -15% loss.
Lesson: Twitter FOMO = automatic loss. Add to rules."
Finding Your Weakness Patterns
After 20-30 tracked trades, patterns emerge. Look for:
Time patterns: Do you lose more on weekends? During work hours? Late at night?
Coin patterns: Are you better at large caps or altcoins? Memecoins killing your account?
Emotion patterns: Do "revenge trades" after losses always fail? Do you sell winners too early?
Here's what one beginner discovered after tracking 50 trades:
- Lost money on 80% of trades placed after 10 PM (tired trading)
- Made money on 70% of Bitcoin trades, lost on 75% of altcoin trades
- Every "double down" on a losing position made it worse
That's actionable intelligence. Now they don't trade after 10 PM, focus on Bitcoin, and never double down.
Common Mistake: "This loss was just bad luck, no lesson here." There's ALWAYS a lesson. Even if it's "my stop loss was in the right place, this was the 30% of trades that don't work out."
Creating Rules From Mistakes
Every mistake should become a rule. Here's how:
- Mistake: Bought at the top of a pump, lost 30% Rule: Never buy after a coin is up 20%+ in 24 hours
- Mistake: Moved stop loss down, lost extra $500 Rule: Stop losses only move up, never down
- Mistake: Revenge traded after a loss, lost more Rule: After any loss over $200, no trading for 24 hours
Write these rules down. Read them before each trade. Your future self will thank you.
Tools and Resources for Tracking
Free Spreadsheet Templates
You don't need fancy software. Here's what your basic spreadsheet needs:
Essential formulas to include:
- P&L % = ((Exit Price - Entry Price) / Entry Price) × 100
- Total P&L = SUM of all P&L columns
- Win Rate = (Winning Trades / Total Trades) × 100
- Average Win = AVERAGE of all positive P&L
- Average Loss = AVERAGE of all negative P&L
Portfolio Tracking Apps
For basic tracking:
- Blockfolio (now FTX): Free, tracks prices and basic P&L
- CoinGecko Portfolio: Free, simple, good for holdings
- Delta: Free version available, nice charts
For serious analysis:
- CoinTracker: Tax reporting + performance metrics
- Koinly: Excellent for tax + detailed analytics
- TradingView Journal: Built into TradingView charts
Using Exchange Reports
Every major exchange provides trade history:
Binance: Spot Wallet → History → Trade History → Export Coinbase: Portfolio → History → Download CSV Kraken: History → Trades → Export
Download these monthly. Even if you're using another tracking method, these are your backup. They're the truth when memory fails.
Pro Tip: Set a monthly calendar reminder to download and review your exchange history. First Sunday of each month, spend 20 minutes reviewing what worked and what didn't.
Making Improvements Based on Data
The Monthly Review Process
Once a month, sit down with your trading journal for 30 minutes. Here's your checklist:
Calculate the big numbers:
- Total P&L for the month
- Win rate percentage
- Average win vs. average loss
- Best performing strategy
- Worst performing strategy
Look for patterns:
- Best trading days/times
- Most profitable coins
- Most costly mistakes
- Emotional state during losses
Make adjustments:
- Create new rules based on mistakes
- Adjust position sizes based on win rates
- Focus more on what's working
- Eliminate or fix what's not
Setting Realistic Performance Goals
Forget the "10x in a month" fantasies. Here are realistic goals based on your experience level:
First 3 months: Don't lose money (seriously, breaking even is winning) Months 4-6: 5-10% total profit Months 7-12: 10-20% total profit Year 2+: 20-30% annual returns
The stock market averages 10% per year. If you can beat that consistently, you're doing great.
When to Adjust Your Strategy
Your data will tell you when something needs to change:
Red flags requiring immediate change:
- 5 losses in a row
- Down 20% from your starting capital
- Win rate below 30% after 20 trades
- Average loss 3x bigger than average win
Green lights to scale up:
- 3 profitable months in a row
- Win rate above 50% for 30+ trades
- Risk-reward ratio above 2:1 consistently
- Following your rules for 30 straight trades
Don't change everything at once. Adjust one variable, track for 10 trades, then evaluate.
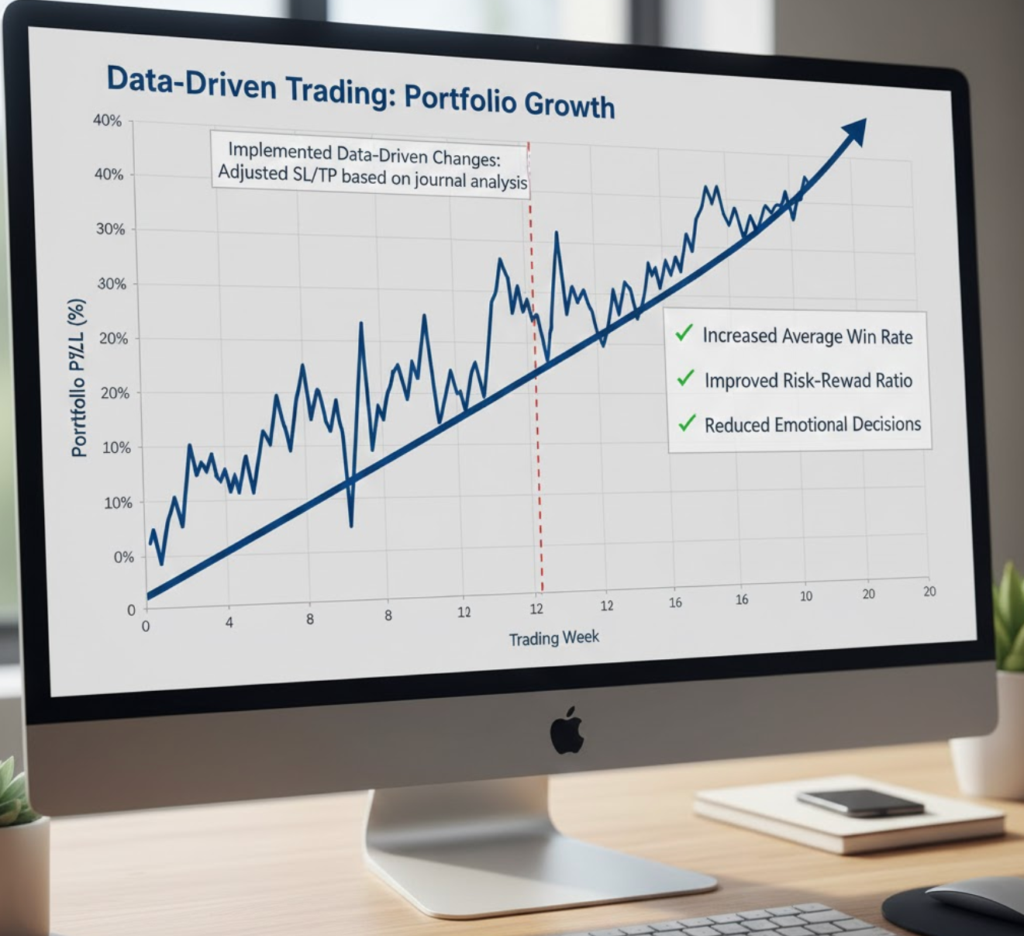
Chart showing performance improvement over time after implementing data-driven changes
Quick Recap
Here's what we covered:
- Your memory lies—you remember wins and forget losses without tracking
- Track the essentials—entry, exit, fees, and reasoning for every trade
- Win rate doesn't equal profit—risk-reward ratio matters more
- Real P&L includes all fees—those 0.5% charges add up fast
- Losses are tuition—but only if you analyze and learn from them
- Patterns emerge after 20-30 trades—showing your strengths and weaknesses
- Monthly reviews drive improvement—30 minutes per month can save thousands
- Realistic goals keep you trading—aim for consistency, not home runs
What is the difference between amateur traders and professionals? Professionals know exactly how they're performing at all times. Amateurs hope they're winning.
Your Next Steps
Tracking your performance isn't optional if you want to succeed at trading. It's the foundation everything else builds on. Here's how to start immediately:
- Today: Create your trading journal. Use Google Sheets or download a free template. Add your last 5 trades from memory or exchange history. Include fees. Calculate your real P&L. You might be surprised.
- This Week: Commit to logging every single trade for the next 7 days. Set phone reminders if needed. After each trade, immediately record: entry price, exit price, fees, and one sentence about why you entered/exited.
- This Month: Schedule your first monthly review for 30 days from now. Put it in your calendar. When that day comes, calculate your win rate, average wins vs. losses, and write down three patterns you notice. Create one new rule based on your biggest mistake.
The Fat Pig Signals community shares tracking templates and helps members analyze their performance patterns. You don't have to figure this out alone.
Join our Telegram group here and get access to our tracking templates plus real traders who'll help you spot the patterns in your data. If you're not tracking, you're not trading—you're gambling. And the house always wins against gamblers.
Start tracking today. Not tomorrow. Not next week. Today. Your future profitable self will thank you for every trade you document. The data doesn't lie. The question is: Are you brave enough to look at it?
Disclaimer: This article is for educational purposes only and should not be considered financial advice. Cryptocurrency trading involves substantial risk of loss. Always do your own research and consider consulting with a financial advisor before making investment decisions.
Related Articles

7 Reasons Why You Lose Money In Crypto Trading

Bitcoin Options Strategy that Lets Traders Profit While Also Hedging