How to Spot False Breakouts and Avoid Fakeouts in Crypto
Trading
You've been watching Bitcoin hover below a resistance level for days. Finally, the price punches through—your heart races, you jump into a long position, and then… it immediately drops back down. Within minutes, you're staring at a red trade and wondering what just happened.
If this sounds painfully familiar, you've experienced a false breakout—or as traders call it, a fakeout. It's one of the most common (and frustrating) traps in crypto trading, and it catches beginners and experienced traders alike.
Here's the good news: fakeouts aren't random. They follow patterns, and once you know what to look for, you can avoid most of them—and even profit when they happen to others.
In this guide, you'll learn:
- What a false breakout actually is and why it happens
- The warning signs that a breakout might be fake
- Simple strategies to confirm real breakouts before you risk your money
- How to turn fakeouts into opportunities instead of losses

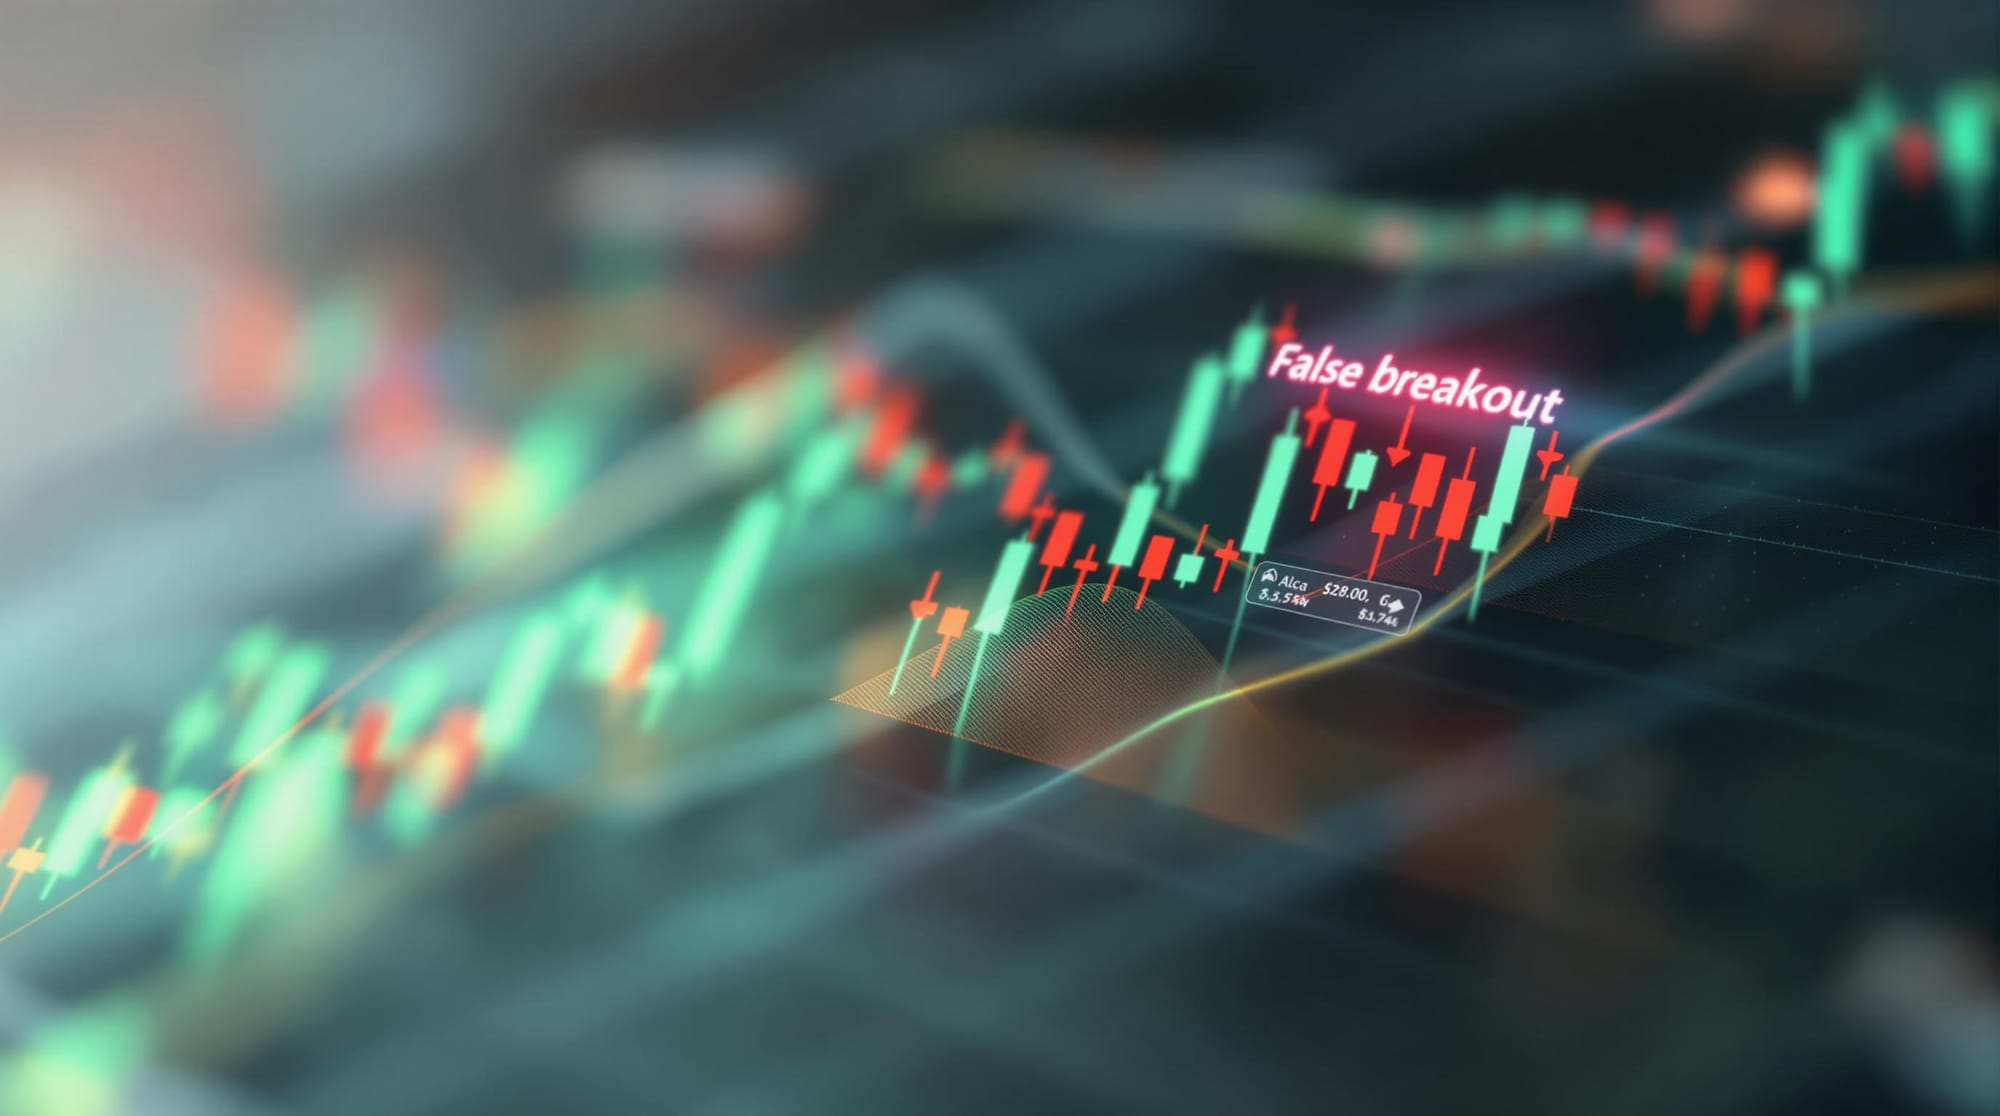
An Illustration of a False Breakout Pattern in Crypto Signals. Image Source: TradingView
What Is a False Breakout? (And Why Does the Market "Trick" You?)
Let's start with the basics. A breakout happens when the price of a cryptocurrency pushes above a resistance level (a price ceiling it keeps bumping into) or drops below a support level (a price floor it keeps bouncing off). When a breakout is real, price keeps moving in that direction with momentum.
A false breakout is when the price appears to break through one of those levels, but then quickly reverses and snaps back inside the previous range. You thought the price was escaping—but it was a trap.
Think of it like a dog on a leash. The dog runs toward the fence and looks like it's going to break free, but the leash yanks it right back. That's a fakeout.
So why does this happen? There are a few reasons:
- Not enough traders agree. The breakout lacks volume—not enough buyers or sellers are pushing the move, so it fizzles out.
- Big players are hunting your stop-loss. Large institutions and whales sometimes push the price just past a key level to trigger stop-loss orders from smaller traders. Once those orders fill, the big players collect cheap coins and the price reverses. This is called stop hunting, and it's very common in crypto.
- The market is just testing the level. Sometimes price "pokes" above resistance or below support to see if there's real interest. If there isn't, it pulls back.
⚠️ Common Mistake: Jumping into a trade the instant price crosses a support or resistance level. This is how most beginners get caught in fakeouts. The breakout looks exciting at the moment, but without confirmation, you're essentially gambling.
How to Tell If a Breakout Is Real or Fake
You can't predict every fakeout, but you can dramatically improve your odds by checking for a few key signs before entering a trade. Think of these as your "fakeout detection checklist."
Check #1: Is There a Strong Volume Behind It?
This is the single most important question. Volume (the total amount of a coin being traded) tells you how many traders are participating in the move. A real breakout needs a crowd behind it—lots of buyers piling in to push prices higher, or lots of sellers driving it lower.
If the price breaks above resistance but volume is low or average, that's a major red flag. It means only a handful of traders are involved, and the move probably won't stick.
What to look for: Volume that's at least 50% higher than the recent average during the breakout. Some traders look for volume that's double or triple the norm for extra confidence. Most charting platforms like TradingView show volume bars right below the price chart—the taller the bar, the more activity.
Check #2: Does the Candle Close Beyond the Level?
This is a simple but powerful filter. Instead of reacting the moment the price touches a level, wait for the candle to close.
A candle (those red and green bars on your chart) represents price movement over a specific time period—like 1 hour or 4 hours. If the candle closes above resistance (meaning it ends the period above that level), the breakout has more weight. If the price spiked above resistance but the candle closed back below it, that spike was likely a fakeout.
💡 Pro Tip: The longer your candle timeframe, the more reliable this filter becomes. A breakout confirmed on a 4-hour or daily candle is much more trustworthy than one on a 5-minute chart, which is full of noise and false signals.
Check #3: What's the Bigger Picture Saying?
One of the best ways to avoid fakeouts is to zoom out. This is called multi-timeframe analysis—checking what the trend looks like on a higher timeframe before acting on a signal from a lower one.
For example, let's say you spot a breakout above resistance on the 15-minute chart. Before you trade it, switch to the 4-hour or daily chart. Is the overall trend pointing in the same direction as your breakout? If yes, the breakout is more likely to be real. If the bigger trend is going against your breakout, there's a higher chance it's a trap.
Think of it like checking the weather forecast before driving. The sky might look clear in your neighborhood, but if there's a storm system heading your way, you probably want an umbrella.
Check #4: Does the Breakout Hold on a Retest?
Here's a pattern experienced traders love: the retest. After a genuine breakout, price often pulls back to the level it just broke through—almost like it's double-checking. If the level holds (old resistance becomes new support, or old support becomes new resistance), that's strong confirmation.
If the price breaks through, comes back, and then falls right through the level again, the breakout has failed. A successful retest usually shows lower volume on the pullback (meaning sellers aren't very aggressive) and then renewed buying as price bounces off the level.
Two Simple Strategies for Dealing with Fakeouts
Now that you know how to spot them, let's talk about what to actually do.
Strategy 1: The "Wait and Confirm" Approach
This is the safest strategy for beginners. Instead of chasing every breakout, you simply wait for confirmation before entering a trade.
Here's the step-by-step process:
- Identify the level. Mark the key resistance or support level on your chart.
- Watch the breakout. When price moves beyond the level, don't trade yet. Just observe.
- Check the volume. Is it significantly above average? If not, stay out.
- Wait for the candle to close. Did it close beyond the level? Good sign.
- Wait for the retest. Does the price pull back to the level and bounce? That's your confirmation—now consider entering.
Yes, you might miss the very start of the move. But you'll also avoid getting trapped in the fakeouts that ruin your account. Remember: a missed trade is not a loss. A fakeout trade is.
In the Fat Pig Signals Telegram community, we often discuss live breakouts and help each other decide whether to wait for confirmation or stay out entirely. Having extra eyes on the chart makes a huge difference.
Strategy 2: Trading the Fakeout Itself
This is a slightly more advanced move, but once you understand fakeouts, you can actually trade in the opposite direction when one happens.
Here's how it works: Price breaks above resistance, but you notice low volume and a long wick on the candle (the price spiked up but got pushed back down). The candle closes back below resistance. This tells you buyers couldn't hold the level—so sellers might take control.
You could enter a short position (betting the price will drop), with a stop-loss just above the fakeout wick. Your target? The middle of the range or the opposite support level.
This takes practice, so start by watching for these patterns without risking real money. Never trade more than you can afford to lose, and always use a stop-loss to limit your downside.
Quick Recap
Here's what we covered:
- A false breakout (fakeout) is when price briefly crosses a key level but reverses quickly—trapping traders who jumped in too early
- Low volume during a breakout is the biggest red flag—real breakouts need strong participation
- Wait for the candle to close beyond the level—don't react to spikes in real time
- Use multi-timeframe analysis—check the bigger trend before trading a breakout on a small timeframe
- Watch for the retest—a successful pullback to the broken level confirms the breakout is likely genuine
- You can trade fakeouts in the opposite direction—but practice this with small positions first
The key lesson? Patience beats speed in breakout trading. Waiting for confirmation might feel slow, but it keeps you on the right side of the market far more often.
Your Next Steps
1. Today: Pull up a Bitcoin chart on TradingView and mark the most obvious support and resistance levels. Look at recent breakouts and check whether they had strong volume or weak volume. Start building your eye for this.
2. This Week: Practice the "Wait and Confirm" method on paper. When you see a breakout, don't trade—just write down whether it had strong volume, whether the candle closed beyond the level, and whether a retest happened. Track how many would have been real versus fake.
3. Ongoing: Join the Fat Pig Signals Telegram community where we share real-time chart analysis, flag potential fakeouts, and help each other confirm breakouts before committing capital. Learning alongside other traders accelerates your progress like nothing else.
Every experienced trader has been burned by fakeouts—it's part of the learning process. What separates the successful ones is that they learned the patterns, built their checklists, and stopped chasing every move. You're already ahead by reading this. Keep building that discipline, start small, and trust the process.
Disclaimer: This article is for educational purposes only and should not be considered financial advice. Cryptocurrency trading involves substantial risk of loss. Always do your own research and consider consulting with a financial advisor before making investment decisions.
Related Articles

How to Set Stop Losses and Take Profit Targets

How to Identify Bullish and Bearish Market Trends