How to Analyze On-Chain Data for Better Trading Decisions
Trading
“If Everything Is on the Blockchain… Can I Actually See What’s Happening?”
Have you ever heard someone say, “Smart money is accumulating” or “Whales are moving funds” and wondered, how do they even know that?
That’s where on-chain data comes in.
Right now, crypto is one of the most transparent financial markets in the world. Every transaction, wallet movement, and token transfer is recorded publicly on the blockchain. You just need to know how to read it.
By the end of this guide, you’ll understand:
- What on-chain data really means (in simple terms)
- The most useful on-chain metrics for beginners
- How on-chain data connects to real trading decisions
- How to use it without getting overwhelmed
You don’t need to be a data scientist. You just need the right mental framework.
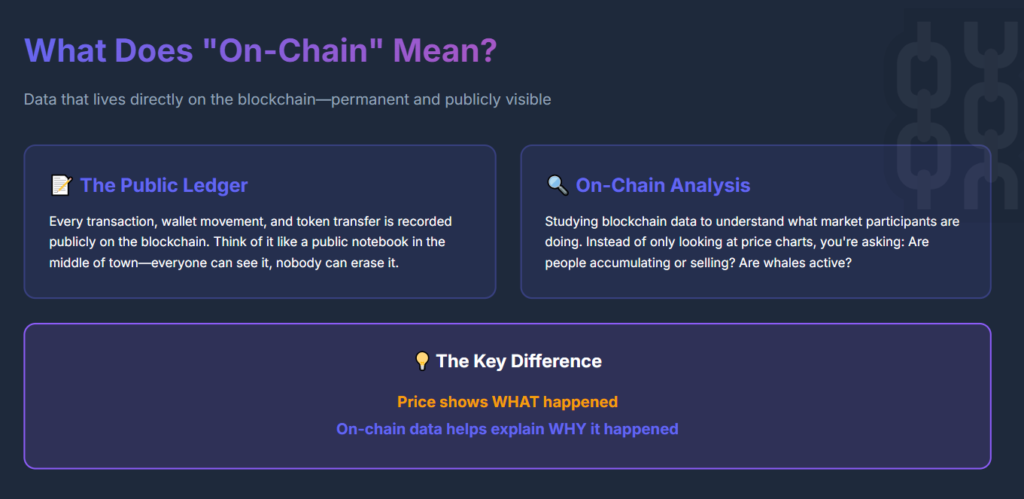
An illustration showing the key points between On-Chain and On-Chain Analysis.
What Does “On-Chain” Actually Mean?
Let’s start from the beginning. On-chain simply means data that lives directly on the blockchain. A blockchain is a public digital ledger that records:
- Transactions
- Wallet addresses
- Token movements
- Timestamps
Once something is recorded on the blockchain, it’s permanent and publicly visible.
Think of It Like This
Imagine a public notebook in the middle of town.
- Every time someone sends money, it’s written down
- Everyone can see it
- Nobody can erase it
On-chain analysis is just reading that notebook intelligently
.
What Is On-Chain Analysis?
On-chain analysis means studying blockchain data to understand what market participants are doing.
Instead of only looking at price charts, you’re asking deeper questions like:
- Are people accumulating or selling?
- Are large wallets (whales) active?
- Are coins moving to exchanges or off them?
Price shows what happened. On-chain data helps explain why it happened.
Why On-Chain Data Matters for Beginners
Crypto markets move on behavior, not just patterns. On-chain data helps you:
- See actions before they show up on price
- Understand supply and demand more clearly
- Avoid emotional decisions based only on headlines
This is why many professional traders use on-chain data as confirmation, not prediction.
Think of charts as the weather report. On-chain data is the satellite image.
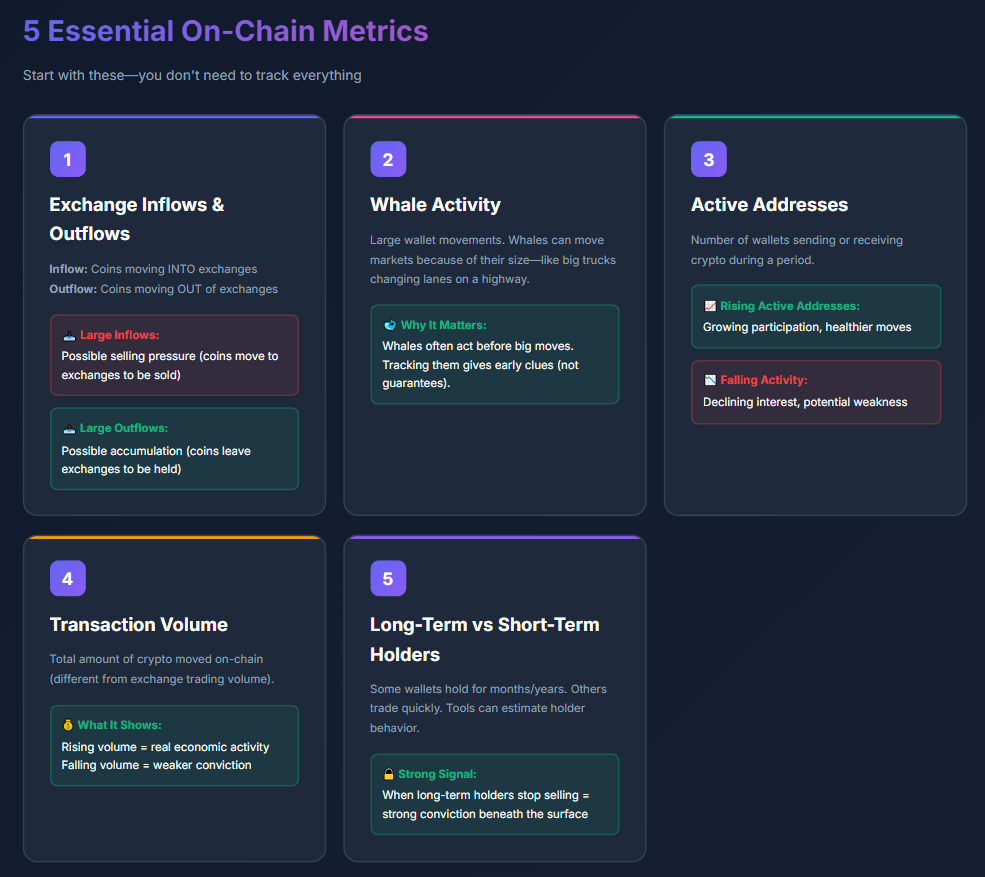
The 5 Most Important On-Chain Metrics
You don’t need to track everything. Start with just these.
1. Exchange Inflows and Outflows
Exchange inflow = coins moving into exchanges
Exchange outflow = coins moving out of exchanges
Why this matters:
- Coins move to exchanges to be sold
- Coins leave exchanges to be held
Simple Example
- 20,000 BTC move into exchanges in one day
→ Possible selling pressure - 30,000 BTC move out of exchanges
→ Possible accumulation
2. Whale Activity (Large Wallet Movements)
A whale is a wallet that holds a large amount of crypto. There’s no fixed definition, but whales can move markets because of their size. Why beginners care:
- Whales often act before big moves
- Tracking them gives early clues, not guarantees
Think of whales like big trucks on a highway—when they change lanes, traffic reacts.
3. Active Addresses
An active address is a wallet that sends or receives crypto during a period. Why this matters:
- Rising active addresses = growing participation
- Falling activity = declining interest
Example
If Bitcoin price rises but active addresses fall:
- Price may be driven by speculation, not real usage
If both rise together:
- The move is usually healthier
4. Transaction Volume
Transaction volume is the total amount of crypto moved on-chain. This is different from trading volume on exchanges. Why it matters:
- Rising on-chain volume = real economic activity
- Falling volume = weaker conviction
It’s like checking how much money is actually moving, not just changing hands on paper.
5. Long-Term vs Short-Term Holders
Some wallets hold coins for months or years. Others buy and sell quickly. On-chain tools can estimate:
- Long-term holder behavior
- Short-term trader panic or confidence
When long-term holders stop selling, it often signals strong conviction beneath the surface.
Practical Example #1: Spotting Accumulation
Imagine this scenario:
- Bitcoin price moves sideways for weeks
- Exchange balances are dropping
- Long-term holders are adding coins
Price looks boring—but on-chain data says: Coins are quietly being accumulated.
This often happens before larger moves.
Practical Example #2: Warning Signs Before a Drop
Now imagine:
- Price is rising fast
- Large wallets send coins to exchanges
- Exchange inflows spike sharply
This doesn’t guarantee a crash—but it tells you: Selling pressure may be building.
That’s valuable context for risk management.
How On-Chain Data Connects to Real Trading Decisions
On-chain data does not tell you:
- Exact entry prices
- Exact tops or bottoms
What it does tell you:
- Whether moves are supported by real behavior
- Whether risk is increasing or decreasing
Think of It This Way
On-chain data answers: “Should I be cautious or confident right now?”
Charts answer: “Where should I enter or exit?”
Together, they’re much stronger.
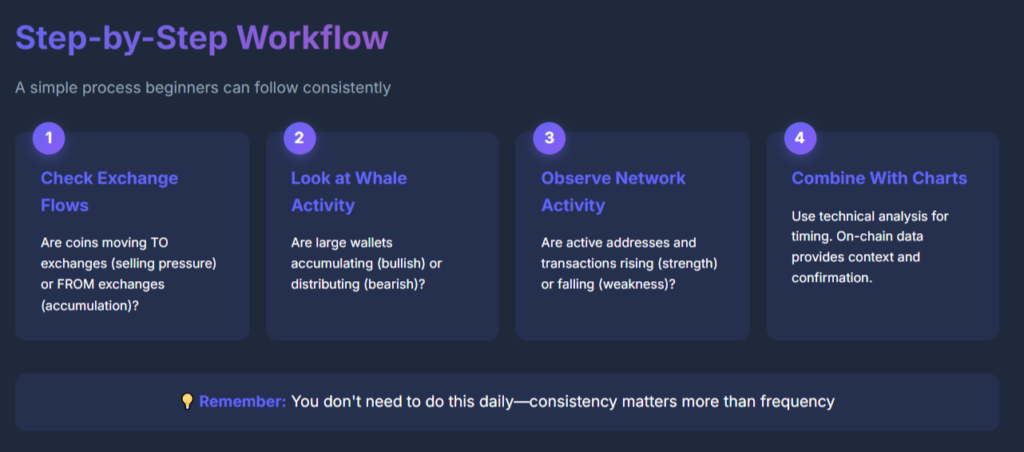
Step-by-Step: How Beginners Can Use On-Chain Data
Here’s a simple workflow you can follow.
Step 1: Check Exchange Flows
Are coins moving to or from exchanges?
Step 2: Look at Whale Activity
Are large wallets accumulating or distributing?
Step 3: Observe Network Activity
Are active addresses and transactions rising or falling?
Step 4: Combine With Charts
Use technical analysis for timing, not guessing.
You don’t need to do this daily—consistency matters more than frequency.
Common Beginner Mistake
Trying to track too many metrics at once. On-chain data can feel overwhelming.
Start with:
- Exchange flows
- Whale movements
- Active addresses
That’s enough to build intuition.
Pro Tip: Use On-Chain Data as Confirmation
If:
- Charts look bullish
- On-chain data supports accumulation
Confidence increases.
If:
- Charts look bullish
- On-chain data shows heavy exchange inflows
Caution increases.
On-chain data doesn’t replace analysis—it strengthens it.
Tools That Make On-Chain Data Easier
You don’t need to read raw blockchain code. Beginner-friendly platforms turn complex data into charts and dashboards. Most traders start with:
- Exchange flow charts
- Whale alerts
- Network activity dashboards
Many traders first observe how professionals interpret these metrics—often through shared breakdowns in communities like Fat Pig Signals’ Telegram—before applying them themselves.
Risk Reminder
Crypto trading involves risk.
- On-chain signals can fail
- Whales can mislead
- Data can lag
Always:
- Start small
- Manage position size
- Use on-chain data as context, not certainty
There are no guaranteed outcomes—only better-informed decisions.
Quick Recap: Key Takeaways
Let’s lock this in:
- On-chain data = blockchain activity
- It shows what people are doing, not guessing
- Key beginner metrics:
- Exchange flows
- Whale activity
- Active addresses
- Transaction volume
- Best used as confirmation, not prediction
- Combine with technical analysis for timing
If this feels clearer now, you’re learning the right way.
Conclusion & Next Steps
On-chain data gives you something rare in trading: transparency. You’re no longer guessing based only on price or emotion. You’re watching how real money moves on the blockchain.
Your next steps:
- Start tracking one on-chain metric consistently
- Compare it with price behavior
- Practice patience—patterns take time
If you want to see how experienced traders interpret on-chain data in real market conditions, observing discussions and examples inside the Fat Pig Signals Telegram community can help you connect raw data with practical decisions.
Take it slow. Stay curious. And remember—you don’t need to trade more to trade better.
Related Articles

Three Common Features Of Successful Crypto Trading

How Traders Can Get Rich With Crypto