How to Use Moving Averages in Crypto Trading
Trading
“Why Does Price Keep Bouncing Off That Line?”
If you’ve ever looked at a crypto chart and wondered “Why does price keep touching that curved line and then bouncing?” — you’re already asking the right question.
That line is called a moving average, and right now, in today’s volatile crypto market, it’s one of the most useful tools for beginners.
When Bitcoin and altcoins move fast, charts can look chaotic. Moving averages help you slow the chart down, spot the trend, and avoid emotional decisions. Instead of guessing, you start reacting to what price is actually doing.
By the end of this guide, you’ll understand:
- What moving averages really are (in plain English)
- The difference between popular types like SMA and EMA
- How beginners actually use them to make trading decisions
- Common mistakes to avoid when you’re just starting out
If you’re new to crypto trading, this is one of the best foundational skills you can learn early.
What Is a Moving Average? (No Math Degree Required)
A moving average is simply the average price of a coin over a certain period of time.
That’s it. Instead of looking at every price jump and drop, a moving average smooths things out so you can see the overall direction.
Think of It Like This
Imagine checking your daily steps:
- Some days you walk a lot
- Some days you barely move
If you only look at one day, it’s misleading. But if you look at your 7-day average, you get a clearer picture. That’s exactly what a moving average does for price.
Why Moving Averages Matter for Beginners (Especially Now)
Crypto markets are emotional. Prices spike on hype and dump on fear.
Moving averages help you:
- Ignore short-term noise
- Focus on the bigger picture
- Avoid panic buying or selling
They’re widely used by traders, which matters because tools work better when many people watch the same thing . This is why moving averages often act like invisible “floors” or “ceilings” on price.
The Two Moving Averages You Actually Need to Know
There are many types, but beginners should focus on just two.
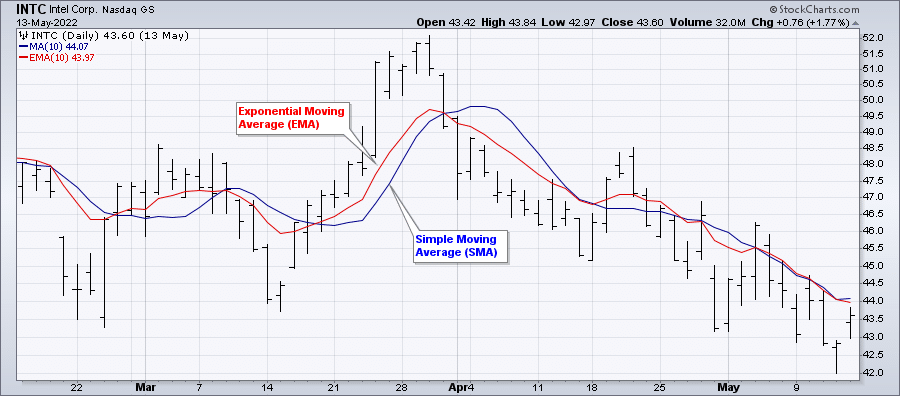
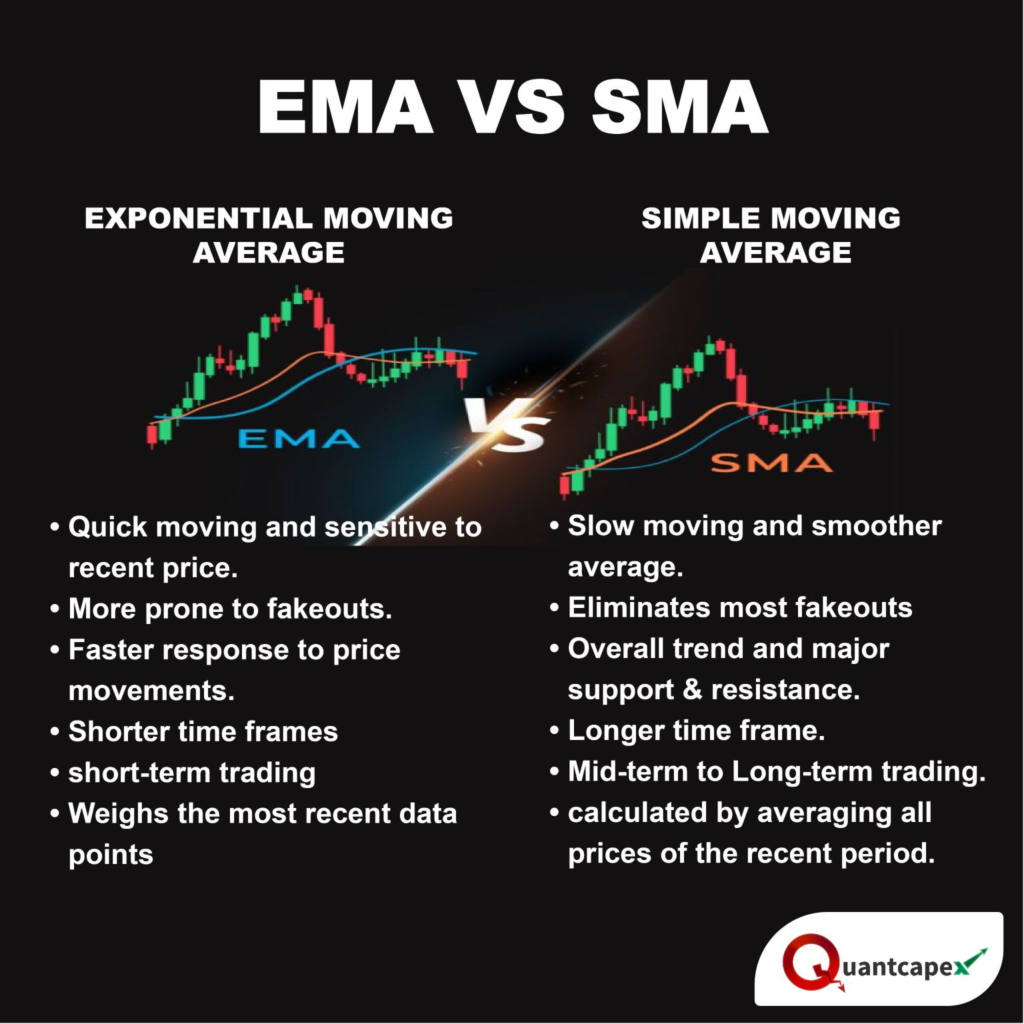
1. Simple Moving Average (SMA)
A Simple Moving Average (SMA) is the average price over a fixed number of periods.
Example:
- A 50-day SMA adds the last 50 closing prices
- Then divides by 50
What it’s good for:
- Seeing long-term trends
- Reducing noise
- Staying patient
Think of it like: Cruise control on a long drive — slow, steady, and reliable.
2. Exponential Moving Average (EMA)
An Exponential Moving Average (EMA) gives more importance to recent prices. That means it reacts faster when price changes direction.
What it’s good for:
- Short-term trading
- Faster signals
- Spotting trend changes earlier
Think of it like: Your car’s accelerator — more responsive, but easier to overreact.
How Moving Averages Help You Identify the Trend
Here’s a simple rule many beginners use:
- Price above the moving average → Uptrend
- Price below the moving average → Downtrend
Practical Example
Let’s say Bitcoin is trading at $62,000.
- The 200-day SMA is at $58,000
- Price stays above it
That tells you buyers are in control, even if price pulls back short-term. This doesn’t mean price can’t drop — but it tells you what side has the advantage.
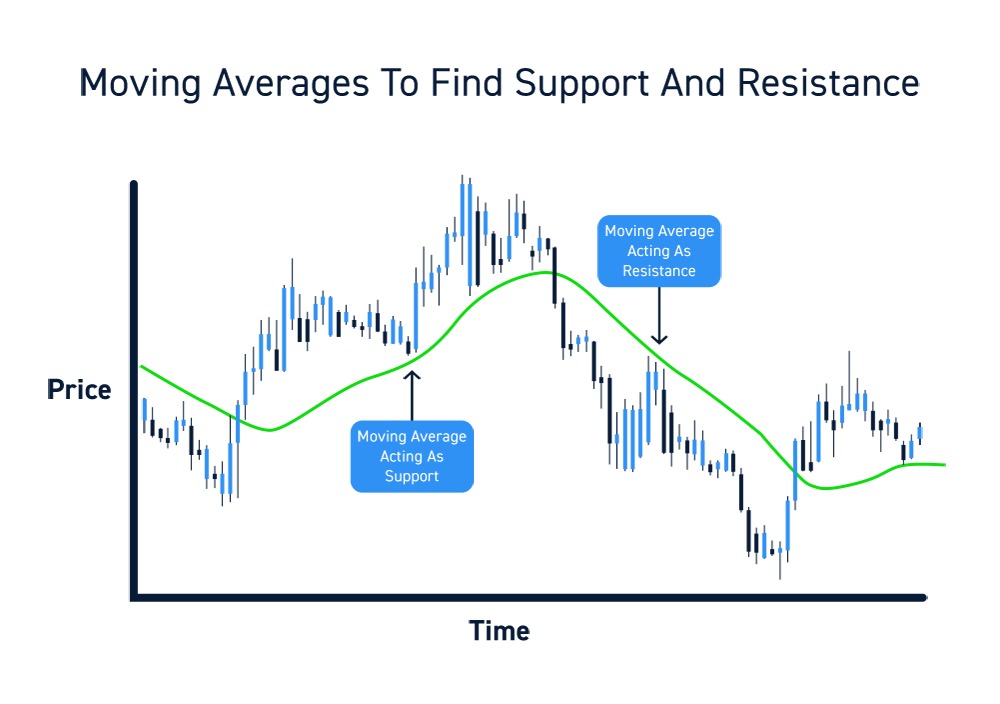
Using Moving Averages as Support and Resistance
Support means a price level where buyers tend to step in.
Resistance means a level where sellers often appear.
Moving averages can act as dynamic support and resistance, meaning they move with price.
Imagine This
Price is climbing.
- It pulls back
- Touches the 50-day EMA
- Then bounces upward again
That EMA acted like a trampoline.
The Famous Crossover Signals
A crossover happens when one moving average crosses another.
Golden Cross (Bullish)
- Short-term MA crosses above long-term MA
- Often watched: 50-day crossing above 200-day
This suggests momentum is shifting upward.
Death Cross (Bearish)
- Short-term MA crosses below long-term MA
- Signals potential weakness
Important: These are confirmation signals, not instant buy or sell buttons.
Step-by-Step: How Beginners Can Use Moving Averages
Here’s a simple process you can follow:
- Add a 50-day and 200-day moving average to your chart
- Identify whether price is mostly above or below them
- Trade with the trend, not against it
- Use pullbacks to the moving average as observation points
![[IMAGE: Beginner chart setup with 50 and 200 MA] Image Source: ForexTrainingGroup](https://www.fatpigsignals.com/wp-content/uploads/2025/12/image-21.png)
Many beginners prefer watching how experienced traders apply this in real setups. That’s why people often observe trades shared in the Fat Pig Signals Telegram community, where moving averages are used alongside risk management — not in isolation .
Common Beginner Mistake
Using moving averages alone. Moving averages are lagging indicators, meaning they react after price moves.
They work best when combined with:
- Support and resistance
- Volume
- Market context
Using them blindly can lead to late entries.
Risk Reminder (Please Read)
Crypto trading involves risk.
- Moving averages do not guarantee profits
- Losses are part of learning
- Start small and stay consistent
Your goal early on is skill development, not quick money.
Quick Recap: Key Takeaways
Let’s lock in what matters most:
- Moving averages smooth price action
- SMA = slower, long-term view
- EMA = faster, short-term view
- Price above MA = bullish bias
- Price below MA = bearish bias
- Best used with other tools, not alone
If this feels clearer than before, you’re making progress.
Conclusion & Next Steps
Moving averages help you see the market more clearly, not predict it perfectly.
Your next steps:
- Open a chart and add a 50-day and 200-day MA
- Observe how price reacts around them
- Practice identifying trends before placing trades
If you want to learn faster, observing real trade examples and explanations inside the Fat Pig Signals Telegram can help you understand how moving averages are used in real market conditions — calmly and with structure .
Take it slow. Learn one concept at a time. You’re building a skill that compounds over years. You’ve got this.
Disclaimer: This article is for educational purposes only and should not be considered financial advice. Cryptocurrency trading involves substantial risk of loss. Always do your own research and consider consulting with a financial advisor before making investment decisions.
Related Articles
Tips to Make the Most of Crypto Signal Services

What are Crypto Launchpads?