Technical Analysis Basics: Candlestick Patterns Explained
Trading
“Why Does Everyone Keep Talking About Candles?”
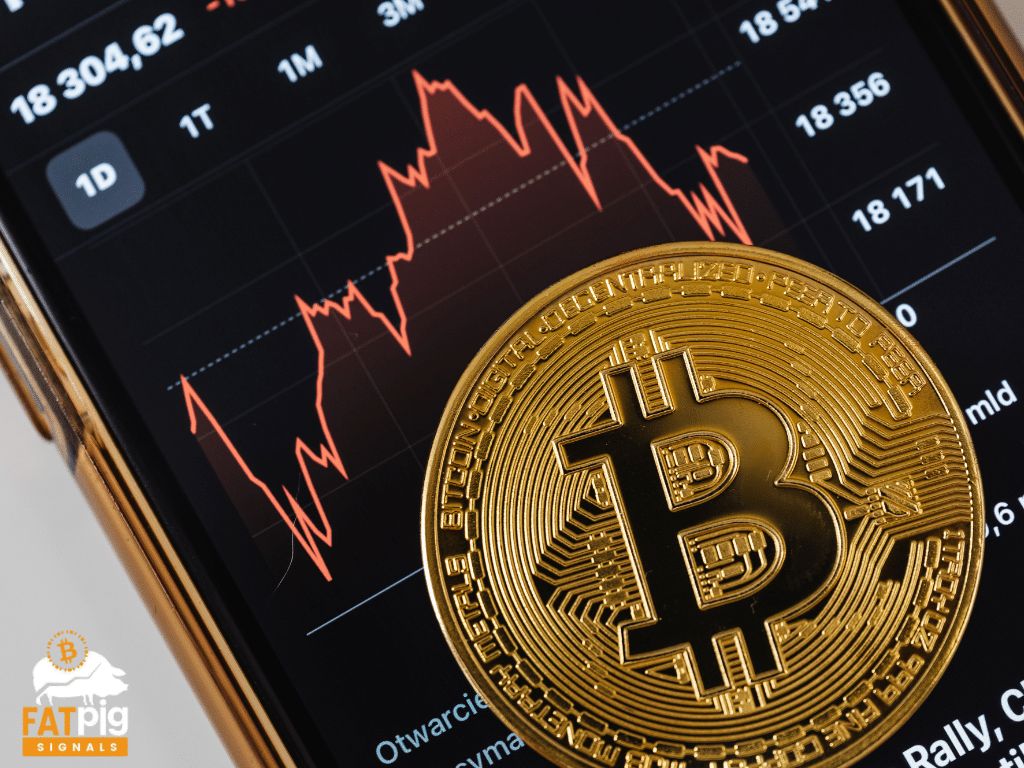
Have you ever opened a crypto chart and thought, “Why does this look like a bunch of red and green candles?” You’re not alone—this is one of the most common questions beginner traders ask.
Candlestick charts are everywhere in crypto trading right now. Whether Bitcoin is chopping sideways or altcoins are pumping, traders use these candles to decide when to buy, when to wait, and when to exit.
The good news? You don’t need to be a math genius or professional trader to understand them.
By the end of this guide, you’ll know:
- What candlestick charts actually show
- How to read a single candle correctly
- The most important beginner candlestick patterns
- How these patterns connect to real trading decisions
If you’re just starting out, this is one of the best skills you can learn early—and it’s exactly how many traders inside the Fat Pig Signals community begin reading charts with confidence
What Is a Candlestick ?
A candlestick is a simple visual way to show price movement over time. Think of it like a daily mood tracker for the market.
Each candle answers four basic questions:
- Where did the price start?
- How high did it go?
- How low did it go?
- Where did it finish?
That’s it. No magic—just price behavior displayed visually
.
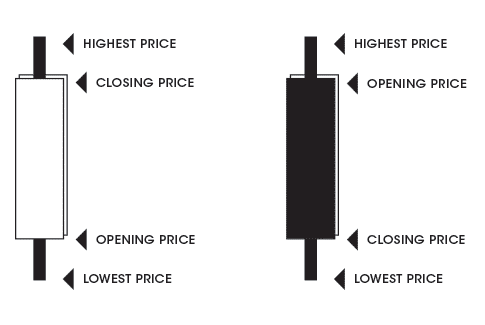
The 4 Parts of a Candlestick (Explained Simply)
Every candlestick has four key components:
- Open – the price at the start of the time period
- Close – the price at the end of the time period
- High – the highest price reached
- Low – the lowest price reached
The thick middle part is called the body. The thin lines above and below are called wicks (or shadows).
Think of it like this: The body shows where price started and ended, while the wicks show where price tried to go but couldn’t stay.
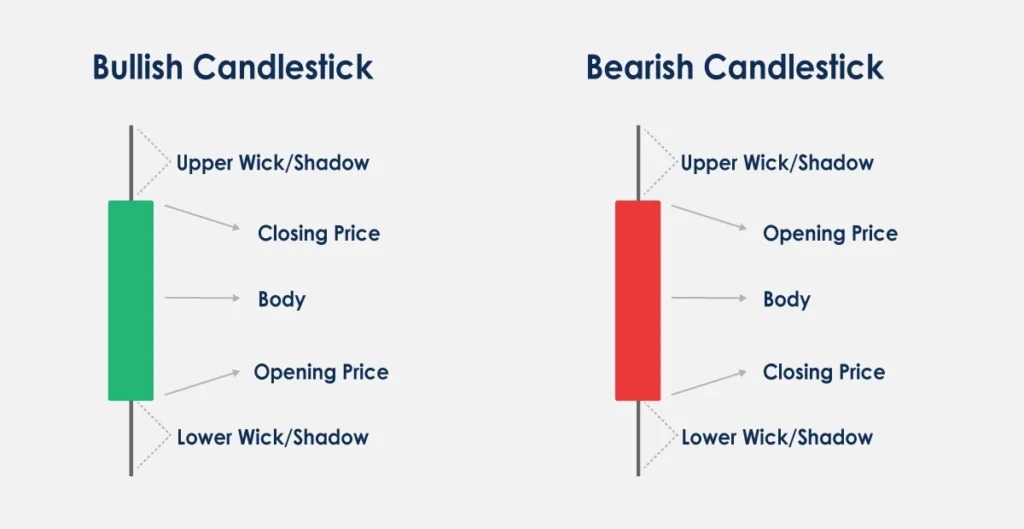
Bullish vs Bearish Candles (Green vs Red)
You’ll usually see candles in two colors:
- Green (Bullish) – price closed higher than it opened
- Red (Bearish) – price closed lower than it opened
Bullish simply means buyers were stronger.
Bearish means sellers were stronger.
Simple Example with Numbers
Imagine Bitcoin opens at $60,000 and closes at $61,200:
- That candle is bullish (green)
If it opens at $61,200 and closes at $59,800:
- That candle is bearish (red)
No guessing—just facts.
Why Candlestick Patterns Matter for Beginners
Here’s the key idea most beginners miss: Candlesticks show trader emotions.
Fear, greed, hesitation, and confidence all leave clues on the chart. Candlestick patterns are simply repeating emotional behaviors that happen again and again in markets
Think of candlestick patterns like:
- Body language in a conversation
- Facial expressions during a negotiation
You’re not predicting the future—you’re reading what’s happening right now.
The Anatomy of Market Emotion (One Candle at a Time)
Before patterns, you must understand single candles.
Long Body vs Short Body
- Long body = strong conviction (buyers or sellers really pushed)
- Short body = indecision (nobody fully in control)
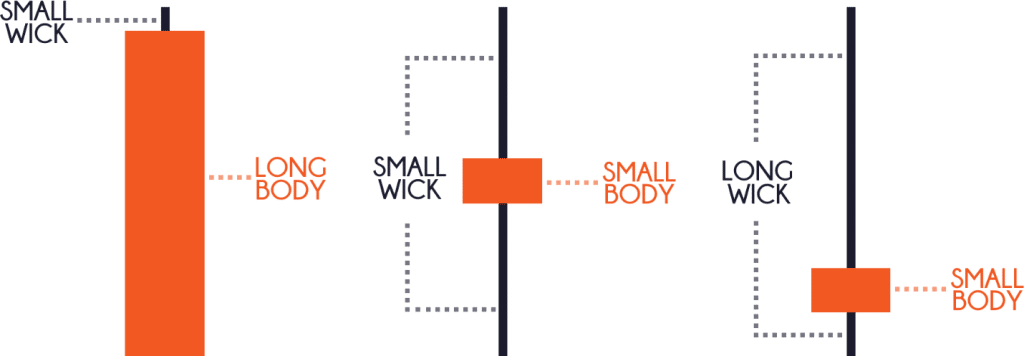
Long Wick vs Short Wick
- Long wick = price was rejected
- Short wick = price moved smoothly
Imagine this: Price jumps up, but then quickly falls back. That long upper wick tells you buyers tried—and failed.
Beginner Candlestick Pattern #1: The Hammer
The Hammer is one of the most beginner-friendly patterns.
What It Looks Like
- Small body at the top
- Long lower wick
- Appears after a price drop
What It Means
Sellers pushed price down…
Then buyers stepped in and pushed it back up.
Think of it like: Dropping a ball and watching it bounce.
Simple Example
- Price falls from $100 to $90
- Buyers buy aggressively
- Price closes near $98
That bounce matters.
Beginner Candlestick Pattern #2: The Doji
A Doji happens when the open and close prices are almost the same.
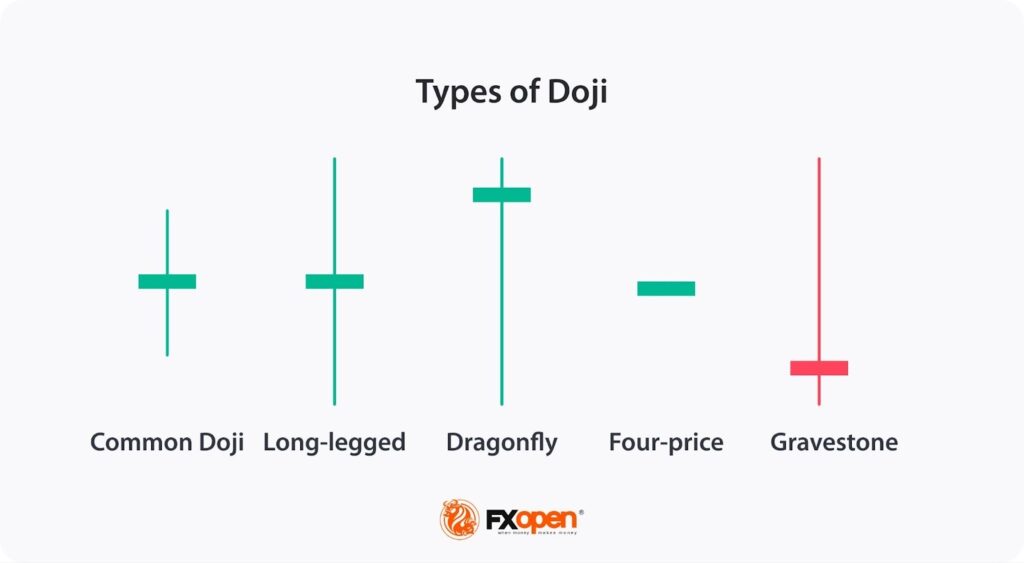
What It Signals
- Indecision
- Buyers and sellers are evenly matched
This often appears before big moves, because the market is deciding its next direction.
Important: A Doji alone is not a trade signal. It’s a warning sign to pay attention.
Beginner Candlestick Pattern #3: Bullish Engulfing
This is one of the strongest beginner patterns.

An Illustration of the Bullish Engulfing Pattern and Bearish Engulfing Pattern. Image Source: Godlove University
What It Looks Like
- Small red candle
- Followed by a large green candle that fully covers it
What It Means
Buyers completely overwhelmed sellers.
Imagine this: Yesterday sellers whispered. Today buyers shouted.
That shift matters a lot
How to Use Candlestick Patterns (Step by Step)
Here’s a simple beginner process you can follow:
- Identify the trend (up, down, or sideways)
- Spot a clear candlestick pattern
- Wait for confirmation (don’t rush)
- Manage risk before entering
![[IMAGE: Chart showing trend + pattern + confirmation] Image Source: Investopedia](https://www.fatpigsignals.com/wp-content/uploads/2025/12/image-1.jpeg)
Common Beginner Mistake
Trading every candle pattern you see
Candlestick patterns work best when combined with:
- Support and resistance levels
- Trend direction
- Volume or confirmation
This is why many beginners prefer following structured signals while learning—like those shared in the Fat Pig Signals Telegram community—so they can see how patterns are used in real setups, not isolation
Risk Reminder (Read This Carefully)
Candlestick patterns:
- Do not guarantee profits
- Can fail—especially in choppy markets
- Should never be used alone
Always:
- Start with small amounts
- Use stop-losses
- Accept losses as part of learning
Crypto trading involves risk, and protecting your capital is more important than chasing wins.
Quick Recap: What You Learned
Before we wrap up, let’s lock this in.
Key takeaways:
- Candlesticks show price behavior and emotion
- Each candle has an open, close, high, and low
- Green = bullish, red = bearish
- Patterns like Hammer, Doji, and Engulfing are beginner-friendly
- Context and confirmation matter more than patterns alone
If this already feels clearer than before—you’re on the right path.
Conclusion & Next Steps
Candlestick patterns aren’t about predicting the future. They’re about understanding what buyers and sellers are doing right now.
Your next steps:
- Open a chart and practice identifying single candles
- Look for the three beginner patterns covered here
- Observe how price reacts after the pattern forms
If you want to speed up your learning, many beginners choose to observe real trades and breakdowns shared inside the Fat Pig Signals Telegram—watching how experienced traders apply candlestick patterns with risk management can shorten your learning curve significantly
Remember: You don’t need to trade perfectly. You just need to learn consistently. You’ve got this.
Disclaimer: This article is for educational purposes only and should not be considered financial advice. Cryptocurrency trading involves substantial risk of loss. Always do your own research and consider consulting with a financial advisor before making investment decisions.
Related Articles
How Traders Capitalize on Crypto Market Crashes and Liquidations
How to Track Your Trading Performance