RSI, MACD, and Other Essential Trading Indicators
Trading
Ever stared at a crypto chart and wondered what all those squiggly lines mean? You're not alone. When I first started trading, technical indicators looked like some kind of secret code that only professional traders could understand.
These indicators are just tools that help you see what's really happening with prices. Today, we're breaking down the essential trading indicators that every crypto trader needs to know. By the end of this article, you'll understand what RSI, MACD, and other key indicators are telling you, and more importantly, how to use them to make better trading decisions.
What Are Trading Indicators Anyway?
Trading indicators are mathematical calculations based on price and volume data. Sounds complicated? It's actually simpler than you think.
Imagine you're trying to figure out if it's going to rain. Look at the clouds, check the humidity, and see which way the wind is blowing. Trading indicators do the same thing for crypto prices—they look at different aspects of price movement to help you predict what might happen next. You don't need to do any math. Trading platforms calculate everything for you and display it as easy-to-read lines and signals on your chart.
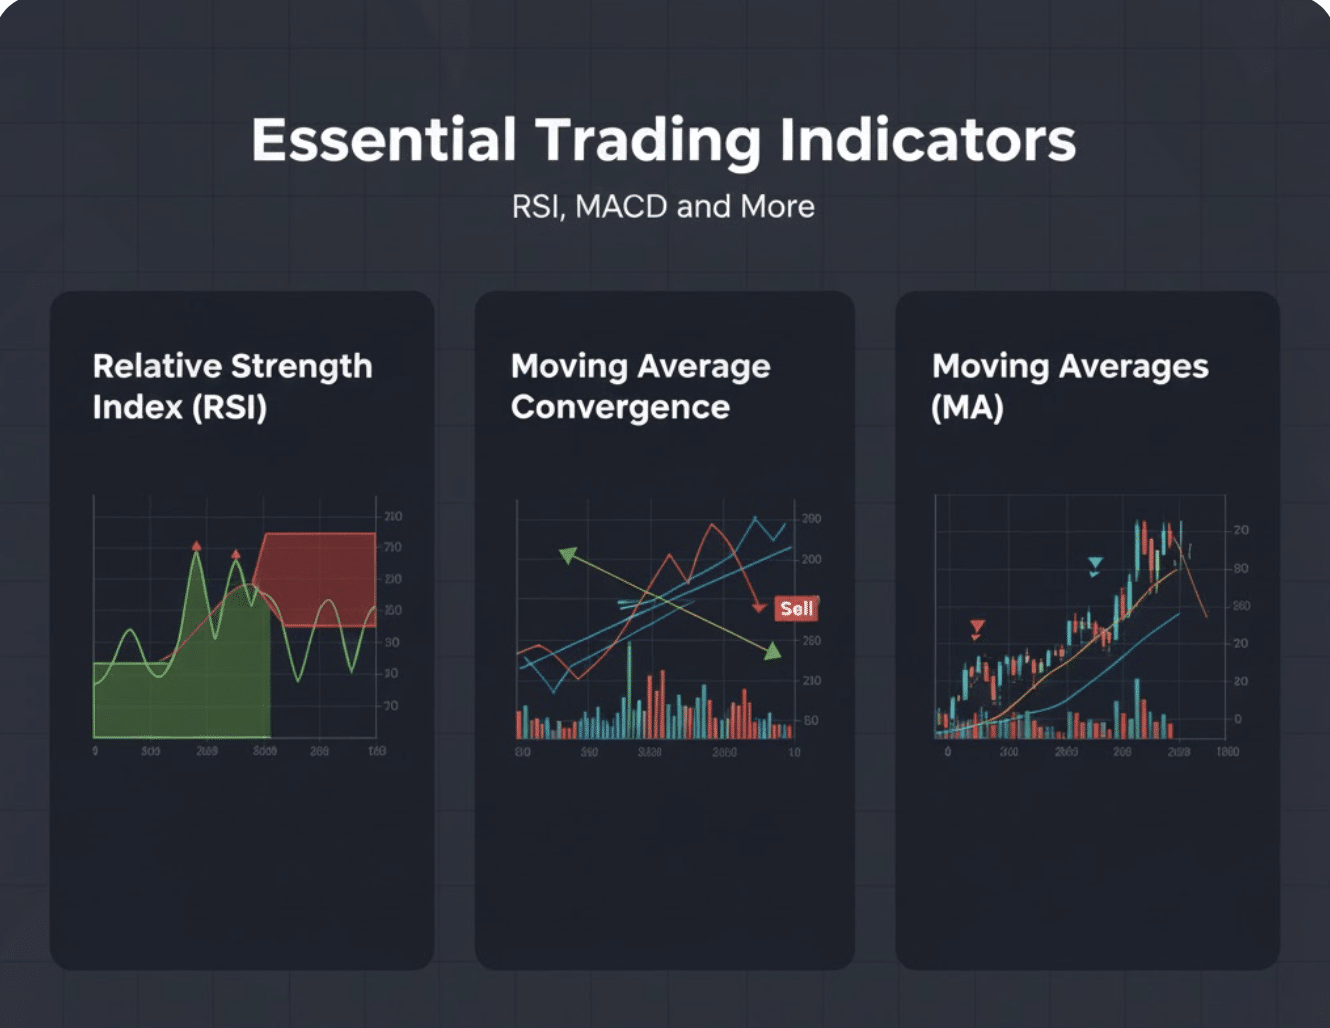
The Big Three: RSI, MACD, and Moving Averages
Let's start with the three indicators that most traders use every single day. Master these, and you'll have a solid foundation for reading any crypto chart.
RSI (Relative Strength Index): Your Overbought/Oversold Detector
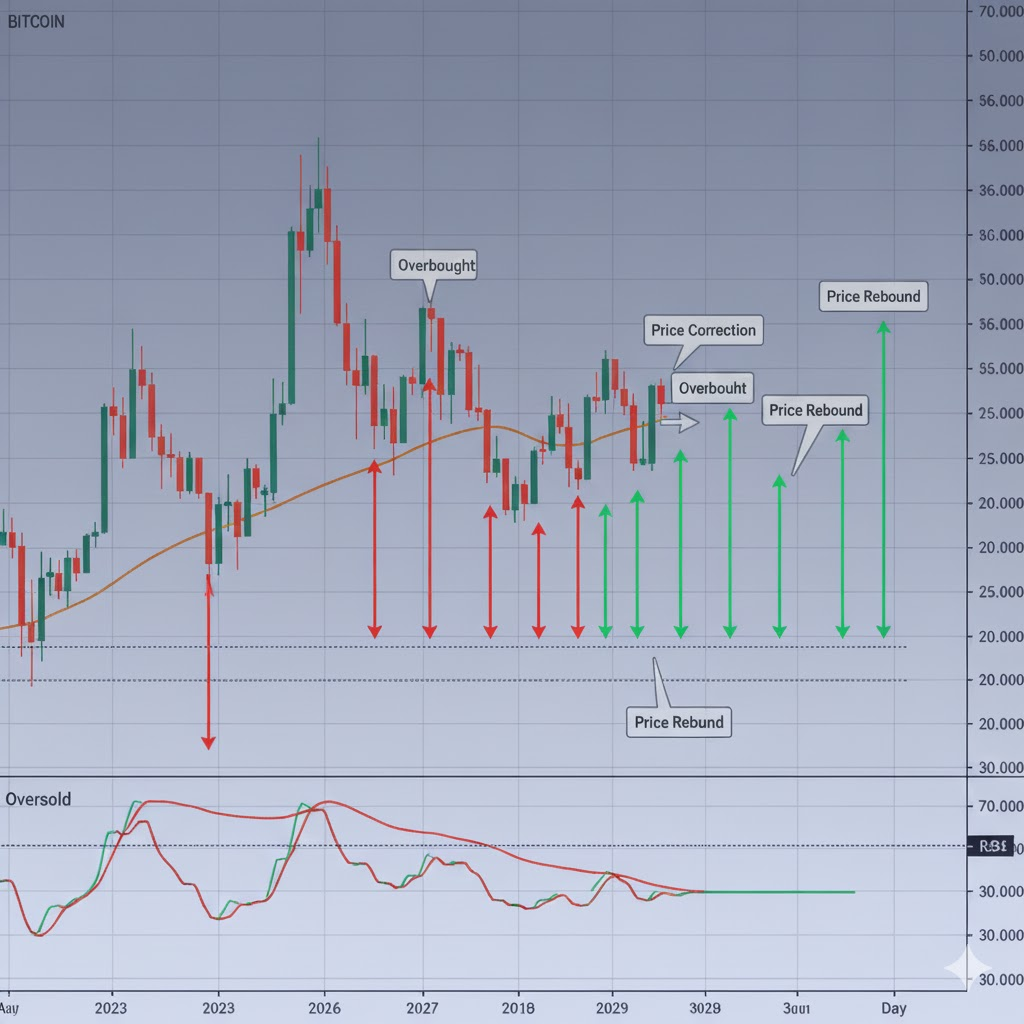
The RSI (Relative Strength Index—a tool that measures if a coin is overbought or oversold) is like a thermometer for market momentum. It tells you if a cryptocurrency is running too hot (overbought) or too cold (oversold).
How it works: The RSI ranges from 0 to 100. Here's what those numbers mean:
- Above 70: The coin might be overbought (too expensive right now)
- Below 30: The coin might be oversold (potentially undervalued)
- Between 30-70: Normal trading range
Think of it like a rubber band. When you stretch it too far in one direction (above 70 or below 30), it tends to snap back toward the middle.
Real-world example: Let's say Bitcoin is trading at $50,000 and the RSI hits 85. That's like seeing a "Caution: Hot Surface" sign. The price has risen so fast that it might need to cool off. Within the next 48 hours, Bitcoin drops to $47,000 as traders take profits. The RSI predicted that pullback.
Pro Tip: Don't use RSI alone. Just because something is overbought doesn't mean it will drop immediately. In strong trends, coins can stay overbought for weeks.
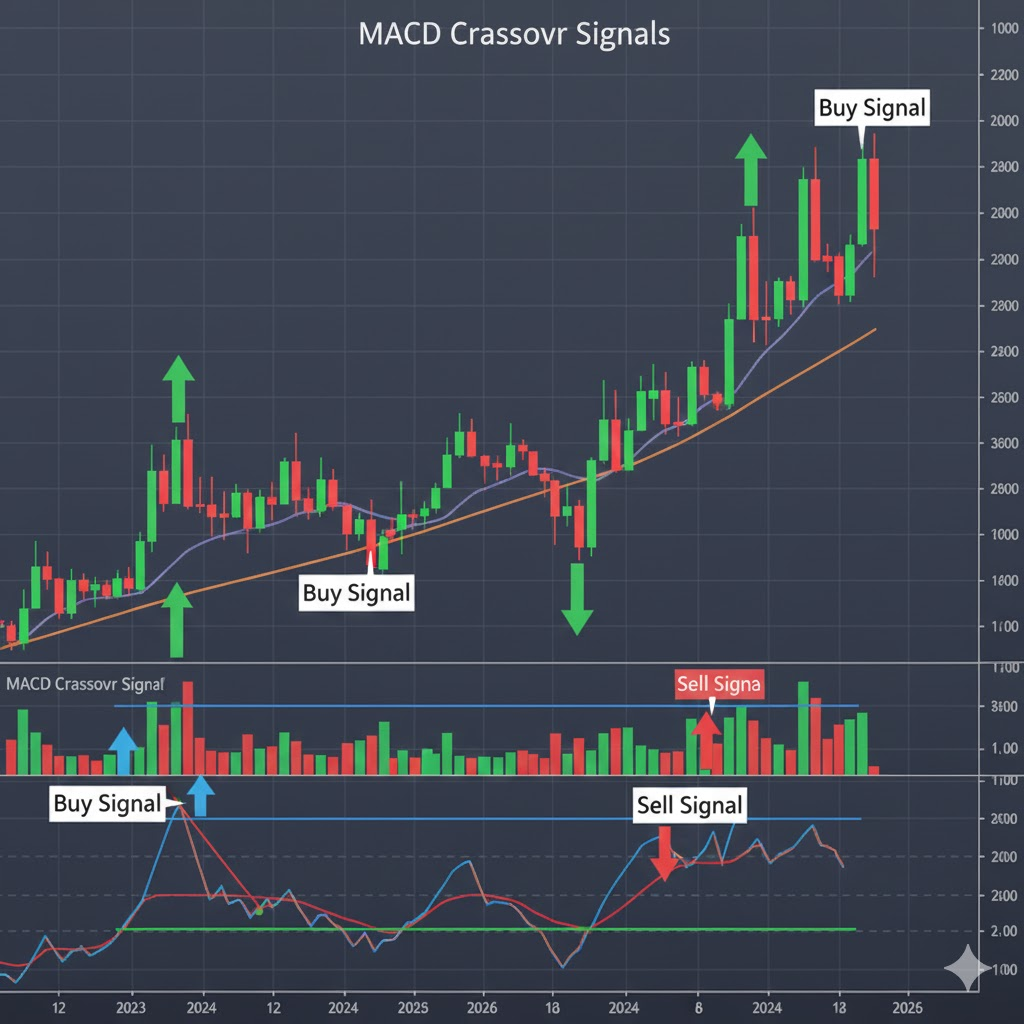
MACD (Moving Average Convergence Divergence): Your Trend Change Radar
The MACD (Moving Average Convergence Divergence—a tool that shows when trends might be changing) is like watching two runners in a race. When they cross paths, something interesting usually happens.
How it works: MACD consists of two lines:
- MACD line (blue): The faster-moving line
- Signal line (red): The slower-moving line
When the blue line crosses above the red line, it's often a buy signal. When it crosses below, it might be time to sell.
There's also a histogram (those vertical bars) that shows the distance between the two lines. Bigger bars mean stronger momentum.
Real-world example: Ethereum is trading at $3,000. The MACD line crosses above the signal line, and the histogram starts growing positive bars. Over the next week, Ethereum climbs to $3,400. The MACD spotted that momentum shift early.
It's actually simple: Blue line up = potentially bullish. Blue line down = potentially bearish.
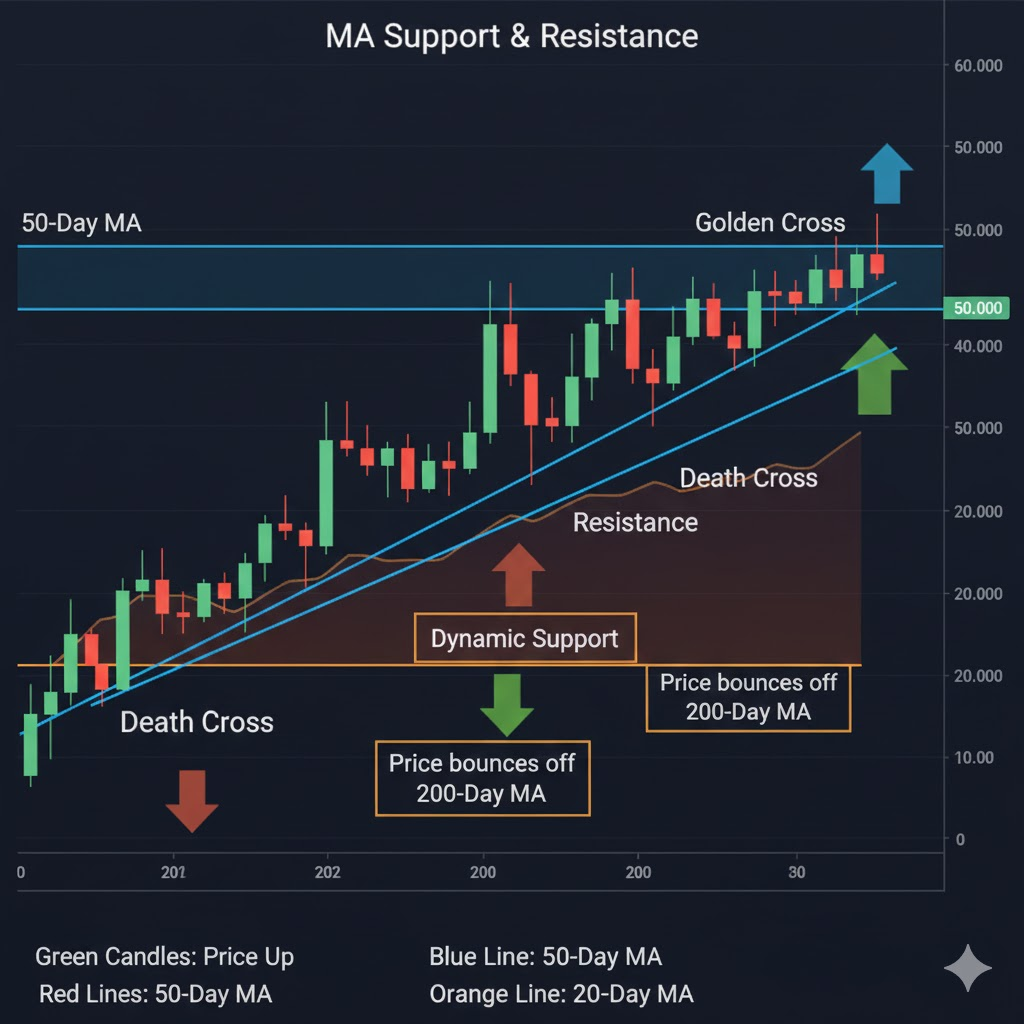
Moving Averages: Your Trend Direction Guide
Moving averages (lines that smooth out price action to show the overall trend) are the simplest but most powerful indicators you'll use.
Think of them like looking at your average speed on a road trip instead of your exact speed every second. They smooth out the noise to show you the bigger picture.
Common types:
- 50-day MA: Shows medium-term trend
- 200-day MA: Shows long-term trend
How to use them:
- Price above the moving average = Uptrend
- Price below the moving average = Downtrend
- When price crosses a moving average, the trend might be changing
Real-world example: Bitcoin has been trading below its 200-day moving average at $45,000 for weeks. Suddenly, it breaks above and closes at $46,000. This is called a "breakout" and often signals the start of a new uptrend. Sure enough, Bitcoin rallies to $52,000 over the next month.
Common Mistake: Beginners often think a moving average crossover means "buy immediately!" Remember, these are just signals, not guarantees. Always consider other factors before trading.
Other Essential Indicators You Should Know
While RSI, MACD, and moving averages form your core toolkit, these additional indicators can give you extra confirmation for your trades.
Bollinger Bands: Your Volatility Measure
Bollinger Bands (bands that expand and contract based on volatility) work like a river with banks on each side. The price usually flows between these boundaries.
When the bands are tight, expect a big move coming (like a coiled spring). When they're wide, the market is already volatile.
Quick rule: Price touching the upper band might mean overbought. Touching the lower band might mean oversold.
Volume: Your Confirmation Tool
Volume (the amount of cryptocurrency being traded) is like counting how many people are at a party. More people usually means more action.
High volume confirms price moves. If Bitcoin jumps 10% on high volume, that's a strong signal. If it jumps 10% on low volume, be suspicious—it might not last.
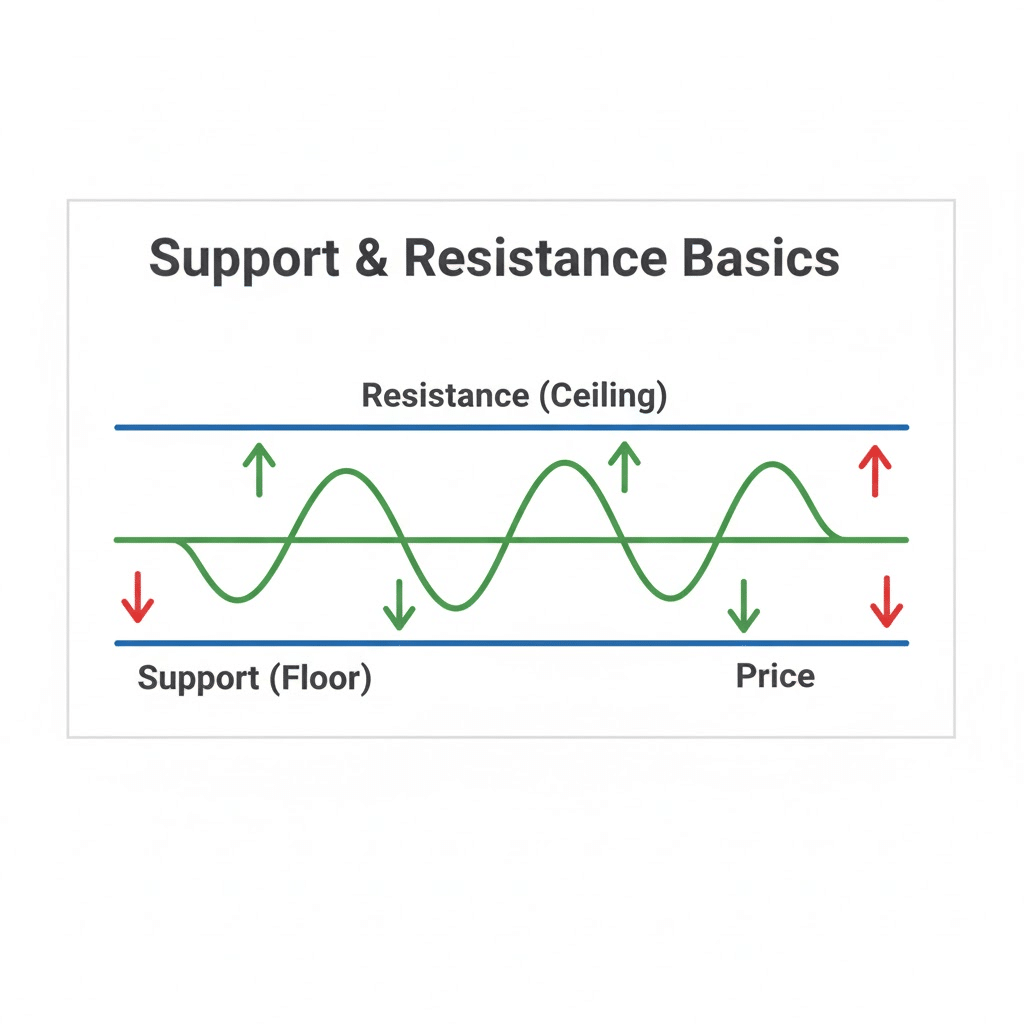
Support and Resistance: Your Price Boundaries
Support (price levels where buying pressure prevents further drops) and resistance (price levels where selling pressure prevents further rises) aren't technically indicators, but they're crucial for using indicators effectively.
Think of support like the floor and resistance like the ceiling. Prices bounce between them until something significant happens to break through.
Read more on How to Read and Interpret Trading Charts
How to Combine Indicators (The Smart Way)
Here's where beginners often go wrong: they use too many indicators at once. Your chart looks like spaghetti, and you're more confused than when you started.
The golden rule: Start with 2-3 indicators maximum. Here are proven combinations:
Combination 1: RSI + Moving Averages
- Use moving averages to identify the trend
- Use RSI to time your entry
- Example: Bitcoin is above its 50-day MA (uptrend) and RSI drops to 35 (oversold). That's a potential buy opportunity in an uptrend.
Combination 2: MACD + Volume
- Wait for MACD crossover
- Confirm with increasing volume
- Example: MACD crosses bullish, and volume spikes. Strong buy signal.
Combination 3: Bollinger Bands + RSI
- Look for price at Bollinger Band extremes
- Check if RSI confirms (overbought/oversold)
- Example: Ethereum touches lower Bollinger Band while RSI shows 25. Double confirmation of oversold conditions.
Remember: No combination is perfect. The goal is confirmation, not prediction.
Common Indicator Mistakes (And How to Avoid Them)
Let me save you from the mistakes I made when I started:
Mistake #1: Indicator Overload
Problem: Using 10 indicators thinking more is better. Solution: Master 2-3 first. Quality over quantity.
Mistake #2: Ignoring the Bigger Picture
Problem: RSI says oversold, so you buy... in a massive downtrend. Solution: Always check the overall trend first. Don't fight it.
Mistake #3: Perfect Signal Hunting
Problem: Waiting for all indicators to align perfectly. Solution: Look for 2-3 confirmations. Perfect setups are rare.
Mistake #4: Not Considering Timeframes
Problem: RSI is overbought on the 1-hour chart but oversold on the daily. Solution: Check multiple timeframes. Higher timeframes are usually more reliable.
Your Indicator Action Plan
Ready to put this knowledge to work? Here's exactly what to do:
Step 1: Pick Your Starting Lineup
Choose one from each category:
- Trend indicator: Moving averages OR MACD
- Momentum indicator: RSI
- Confirmation: Volume
Step 2: Practice Without Money
Open a demo account or use TradingView to practice. Spend a week just watching how your chosen indicators behave. Notice patterns.
Step 3: Create Your Rules
Write down simple rules like:
- "I only buy when price is above the 50-day MA"
- "I consider selling when RSI hits 70+"
- "I need volume confirmation for all trades"
Step 4: Start Small
When you're ready to trade real money, start tiny. Use indicators to guide you, but never rely on them blindly.
Quick Recap
Here's what we covered:
- Indicators are tools, not crystal balls—they help you see patterns but don't guarantee outcomes
- RSI shows overbought/oversold conditions—above 70 might be too hot, below 30 might be oversold
- MACD reveals trend changes—watch for line crossovers
- Moving averages show overall trend direction—price above = uptrend, below = downtrend
- Start with 2-3 indicators maximum—more isn't always better
- Always confirm signals with multiple indicators—don't rely on just one
- Practice first, trade second—get comfortable before risking real money
Your Next Steps
- Today: Add RSI and a 50-day moving average to your favorite chart. Just observe how they move with price for the rest of the day. Don't trade—just watch and learn.
- This Week: Pick one indicator to master. Watch YouTube tutorials, read about it, and observe it on different cryptocurrencies. Notice when it works well and when it doesn't.
- Ongoing: Join the Fat Pig Signals Telegram community where we discuss indicator signals in real-time. Seeing how other traders interpret indicators will accelerate your learning.
Remember: You don't have to figure this out alone. Our Fat Pig Signals community shares indicator setups, discusses what we're seeing on the charts, and helps each other spot opportunities.
Join our Telegram group here and see how experienced traders use these indicators in real market conditions.
Every professional trader starts by learning one indicator at a time. Keep practicing, stay curious, and trust the process. In a few months, reading indicators will feel as natural as checking the weather.
Disclaimer: This article is for educational purposes only and should not be considered financial advice. Cryptocurrency trading involves substantial risk of loss. Always do your own research and consider consulting with a financial advisor before making investment decisions.
Related Articles

How to Read and Interpret Trading Charts

How to Protect Your Portfolio During Bear Markets