The Basics of Technical Analysis for Crypto Trading
Trading
Technical analysis (TA) is a trading discipline used to evaluate investments and identify trading opportunities by analyzing statistical trends gathered from trading activity, such as price movement and volume. For crypto traders, TA is an essential skill, allowing them to make informed decisions without getting caught up in market hype.
Unlike fundamental analysis, which focuses on a crypto's intrinsic value, TA is all about studying the market's pulse through charts. It operates on three core principles:
- Market Action Discounts Everything: The price of a cryptocurrency reflects all available information—news, rumors, investor sentiment, and economic factors.
- Prices Move in Trends: Crypto prices, like all market prices, tend to move in predictable trends (up, down, or sideways). The goal of a technical analyst is to identify and profit from these trends.
- History Tends to Repeat Itself: Patterns and trends observed in the past are likely to reappear in the future. This principle is the foundation of identifying chart patterns.
Key Components of Technical Analysis
To get started with TA, you need to understand a few fundamental components.
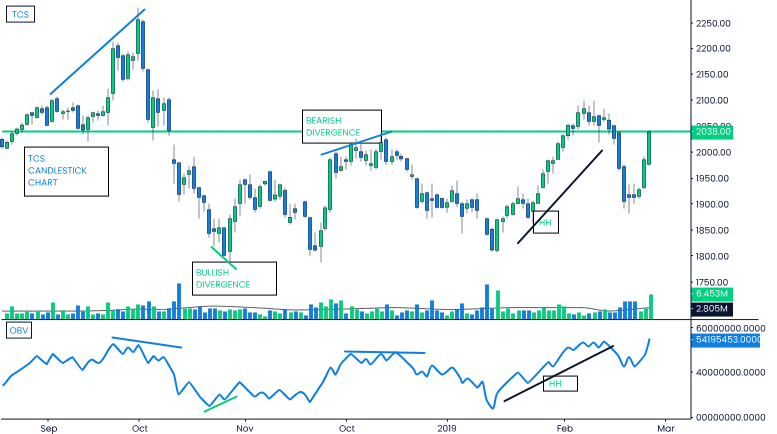
1. Candlestick Charts
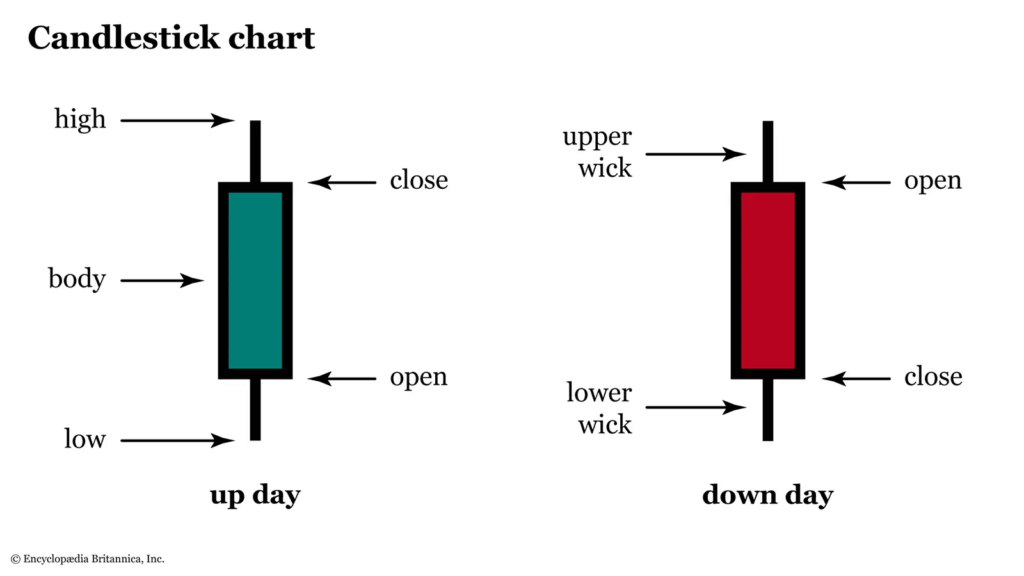
Candlestick charts are the most common way to visualize price data. Each "candle" represents a specific time frame (e.g., 1 hour, 1 day) and shows four key pieces of information:
- Open: The price at the beginning of the period.
- High: The highest price reached.
- Low: The lowest price reached.
- Close: The price at the end of the period.
A green or bullish candle means the price closed higher than it opened. A red or bearish candle means the price closed lower than it opened.
2. Support and Resistance Levels
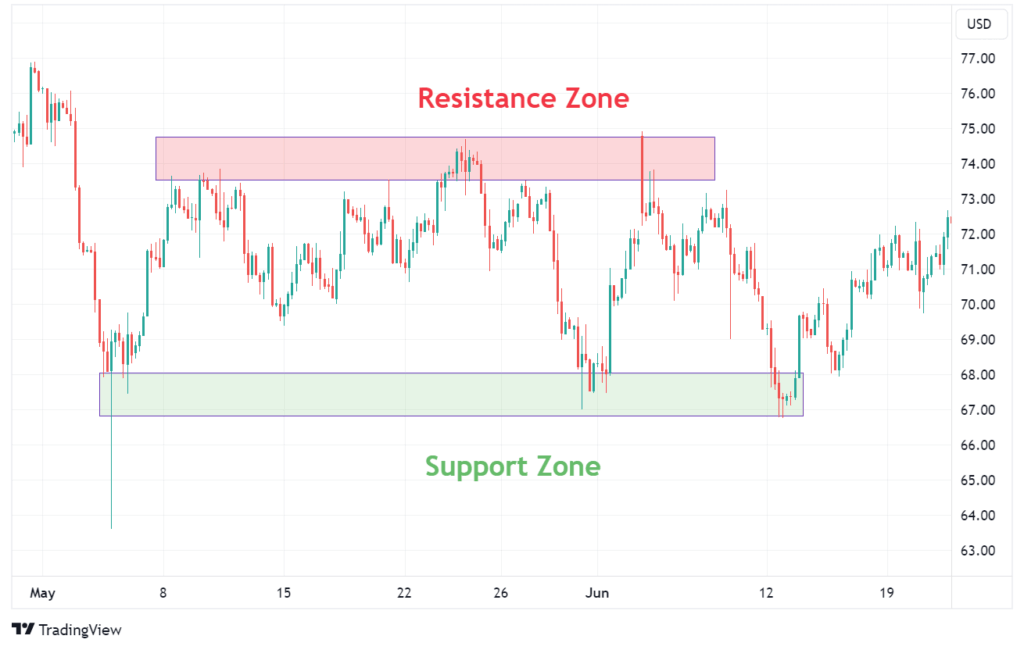
- Support: A price level where a downtrend is expected to pause due to a concentration of demand. Think of it as a price floor where buyers are likely to step in.
- Resistance: A price level where an uptrend is expected to pause due to a concentration of sellers. This acts as a price ceiling.
Identifying these levels helps traders determine potential entry and exit points.
3. Trading Volume
Volume is the total number of cryptocurrency units traded during a given period. It's a crucial indicator of a trend's strength. A strong price move on high volume suggests conviction behind the trend, while a move on low volume is often seen as weak and unreliable.
Also read: Bollinger Bands: How to Easily Spot Trading Opportunities
Common Technical Indicators and How to Use Them
Trading indicators are mathematical calculations based on price, volume, and open interest. They help traders predict future price movements.
Moving Averages (MA)
A moving average smooths out price data to create a single flowing line, helping to identify the direction of a trend. The Simple Moving Average (SMA) and Exponential Moving Average (EMA) are the most popular. When a short-term MA crosses above a long-term MA, it's often seen as a bullish signal (a "golden cross").
Relative Strength Index (RSI)
This momentum oscillator measures the speed and change of price movements. The RSI ranges from 0 to 100. Readings above 70 suggest an asset is overbought and may be due for a correction, while readings below 30 suggest it is oversold and may be due for a bounce.
Moving Average Convergence Divergence (MACD)
The MACD indicator uses two moving averages to identify momentum and potential trend changes. It consists of a MACD line, a signal line, and a histogram. A crossover of the MACD and signal lines often indicates a potential buy or sell signal.
Putting It All Together
Technical analysis is not about using a single indicator. The most effective traders use a combination of these tools to confirm signals and reduce false positives. Start by learning one or two key concepts, and then gradually build a trading strategy that suits your style. Practice on historical charts and paper trading accounts before risking real capital.
Don't Trade Alone. Join the Fat Pig Signals Community. Get Your Crypto Signals Now
Related Articles

How to Identify Bullish and Bearish Market Trends

5 Trading Strategies That Work in Bull Markets